The market story everyone got wrong in January 2026 was simple: rate cuts were coming, risk assets would rip, and Bitcoin would print new highs. Five months later, the script has flipped. Traders are now pricing in a Fed rate hike instead of a cut, Bitcoin is hovering near $75,000 after a brutal slide, and “Extreme Fear” is back on the dashboard.
If you invest in stocks, crypto, or anything that breathes when liquidity expands, this is the regime shift that matters most right now. Here’s what changed, why it’s hitting every asset class at once, and how disciplined investors are positioning into the back half of 2026.
The Fed Just Changed Captains — and Direction
The biggest macro headline of the spring wasn’t a data point. It was a personnel change. Kevin Warsh was sworn in as Federal Reserve chair in late May, replacing Jerome Powell, whose term expired on May 15. New chair, new tone.
Here’s the kicker: bond traders are betting Warsh’s first move will be to raise rates, not lower them. According to the CME FedWatch Tool, markets are now pricing roughly a 70% chance of a rate hike before year-end, with the heaviest odds on a single quarter-point increase from the current 3.50%–3.75% target range. That is a near-total reversal of the easing narrative that dominated late 2025.
For context, the Fed had already cut 175 basis points since September 2024. The expectation heading into 2026 was “one or two more cuts.” Instead, persistent inflation flipped the table. Bank of America pushed its rate-cut forecast all the way out to mid-2027, and even JPMorgan’s Jamie Dimon floated a blunt warning about an eventual credit recession being worse than the market expects.
Why the U-turn? One word: oil
The inflation that refuses to die is being fed by an energy shock. The ongoing Iran war pushed crude sharply higher — WTI traded around $104 — and energy prices feed straight into headline CPI, which has been running well above the Fed’s 2% target (recent reads in the 3.3%–3.7% zone). A central bank can’t credibly cut into a fresh inflation impulse, so “higher for longer” hardened into “maybe higher, period.”
There is a glimmer on the geopolitical side: reports point to a potential U.S.–Iran draft agreement, with the Strait of Hormuz possibly reopening to shipping within 30 days. If that holds, oil could cool — and the entire rate calculus softens with it. Watch the oil tape; it’s the real Fed input right now.
Crypto Is Taking the Macro Punch
When real yields rise and liquidity tightens, the most speculative assets get repriced first. Crypto is doing exactly that.
Bitcoin has been grinding lower, trading in the $74,000–$76,000 band after a multi-day losing streak — a long way from its earlier-year ambitions. Ethereum slipped to around $2,081, and total crypto market capitalization compressed to roughly $2.62 trillion. The Crypto Fear & Greed Index dropped into “Extreme Fear” near 25, its lowest in weeks.
The flows tell the cleanest story. The crypto market posted its worst weekly ETP outflow of 2026 at about $1.47 billion. In plain terms: institutional money walked out the door before retail sentiment even caught up. Exits ran ahead of fear, not behind it.
It wasn’t only macro. A high-profile holder unwinding a large Ethereum position and chatter about restrictions on a major retail on-ramp added selling pressure on top of the rate story. None of it is a “crypto is broken” signal — it’s a liquidity-and-positioning signal.
The contrarian read
Extreme Fear and capitulation-style outflows are the conditions long-term allocators historically watch for, not the ones they run from. That doesn’t mean the bottom is in — it means the risk/reward starts shifting for those with a multi-year horizon and the stomach for volatility. Capitulation is uncomfortable by design.
The Quiet Bull Case Hiding Under the Red Tape
Strip away the daily candles and 2026 has produced some of the most important structural wins crypto has ever had. These are the stories that compound long after the rate cycle resolves.
Stablecoins went truly mainstream. Cash App began rolling out USDC transfers to roughly 60 million users across Solana, Ethereum, Polygon, and Arbitrum — with zero fees and instant conversion to dollars. When a mass-market consumer app puts on-chain dollars in tens of millions of pockets, the addressable market changes permanently.
Regulation got a real framework. A new digital commodity taxonomy from the SEC and CFTC moved from guidance into its first practical applications in May. Clear rules of the road are exactly what large allocators have been waiting for before sizing up.
Tokenization is no longer a buzzword. Tokenized stock trading volume hit a record of about $3.57 billion in a single day, and prediction markets pushed into private-company valuations. The line between “crypto” and “capital markets” is blurring fast.
The takeaway: price is in a drawdown, but adoption is on a tear. Those two things rarely stay disconnected forever.
What About Stocks?
Equities have been more resilient than crypto, and the reason is earnings. Strong first-quarter results powered stocks even as bond yields climbed and the Iran conflict stayed unresolved. Solid corporate profits, resilient consumer spending, and heavy technology investment are doing the heavy lifting.
The caution flag: analysts at Morningstar noted that AI and growth stocks no longer offer much of a margin of safety after their run, and market concentration keeps climbing. Higher-for-longer rates also make bonds a genuine competitor for capital — when short-term Treasuries pay well, investors get pickier about what multiple they’ll pay for future growth.
The 2026 Investor Playbook
This isn’t financial advice — it’s a framework for thinking through a higher-rate, higher-uncertainty tape. Here’s how disciplined investors are approaching it:
Respect the rate regime. If the next Fed move is a hike, the “buy every dip in speculative assets” reflex from the easy-money era is the wrong default. Position sizing matters more than conviction.
Watch oil as your inflation tell. A genuine Iran de-escalation that cools crude could re-open the door to cuts — and re-rate risk assets quickly. The geopolitical headline is the macro trade.
Separate price from adoption in crypto. Drawdowns are loud; structural wins (stablecoins, clear regulation, tokenization) are quiet but durable. Build your thesis on the second, not the first.
Don’t ignore the income on offer. With short rates near 3.5%–3.75%, cash and short-duration bonds finally pay you to wait. Patience has a yield again.
Mind concentration. Mega-cap AI names carry the indexes; understand how much of your portfolio is really one trade in disguise.
FAQ
Is the Fed actually going to raise rates in 2026? Nothing is guaranteed, but as of late May 2026 markets priced roughly a 70% chance of at least one hike before year-end, with new chair Kevin Warsh widely expected to lean hawkish. The path depends heavily on oil prices and inflation data.
Why is Bitcoin falling if crypto adoption is growing? Price reflects short-term liquidity and positioning; adoption reflects long-term demand. In 2026, tightening Fed expectations and large institutional outflows pushed prices down even as real-world usage (like Cash App’s USDC rollout) expanded.
Is now a good time to buy the dip? That depends entirely on your time horizon, risk tolerance, and goals. “Extreme Fear” historically marks zones long-term investors study closely, but it is not a guarantee of a bottom. This article is educational, not personalized advice.
What’s the single biggest variable to watch? Oil. The Iran war is the main inflation driver keeping the Fed hawkish. A credible peace deal that reopens the Strait of Hormuz could cool inflation and reset the entire rate outlook.
Want to actually take action instead of just reading?
Most people understand what they should do with money — the problem is execution. That’s why I created The $1,000 Money Recovery Checklist.
It’s a simple, step-by-step checklist that shows you:
and how to start building your first $1,000 emergency fund without overwhelm.
where your money is leaking,
what to cut or renegotiate first,
how to protect your savings,
and how to start building your first $1,000 emergency fund without overwhelm.
No theory. No motivation talk. Just clear actions you can apply today.
If you want a practical next step after this article, click the button below and get instant access.
Disclaimer: This article is for informational and educational purposes only and does not constitute financial, investment, legal, or tax advice. Cryptocurrency and equity markets are volatile and you can lose money. Always do your own research and consider speaking with a licensed financial professional before making investment decisions.
Tuesday morning, the CPI report landed and made headlines everywhere.
Inflation at 3.8%. Highest since May 2023. Gasoline up 28.4% over the year. Beef up 14.8%. Airline fares up 20.7%. Real wages falling for the second consecutive month. Rate hike odds climbing to 30%.
It was alarming enough that markets sold off. It was alarming enough that Moody’s chief economist Mark Zandi said American households are “going to continue to struggle trying to manage through this, and that’s going to be the case for the foreseeable future.” It was alarming enough that CME futures traders are now pricing zero probability of any rate cuts in 2026.
Then Wednesday morning, the Producer Price Index dropped.
And it was three times worse than expected.
PPI rose 1.4% in a single month — against a Wall Street consensus forecast of 0.5%. Three times the estimate. The largest monthly gain since March 2022. On an annual basis, producer prices are up 6.0% — the biggest increase since December 2022. Core PPI, which strips out food and energy, rose 1.0% for the month — 2.5 times the 0.4% estimate.
After the PPI, rate hike odds jumped from 30% to 39%.
Here is why both numbers matter, why most people are only reading one of them, and why the combination of Tuesday’s CPI and Wednesday’s PPI is the most important inflation signal of 2026 — telling you not just where prices are today, but where they are going in the next 30 to 90 days.
The Difference Between CPI and PPI That Changes Everything
Most people have heard of CPI. Most people have not heard of PPI. That asymmetry is one of the most expensive information gaps in personal finance.
CPI — the Consumer Price Index — measures what you pay. It is the number that shows up in headlines, that politicians cite, that the Fed’s 2% target refers to. It captures prices at the point of final sale: the gallon of gas at the pump, the package of beef at the grocery store, the airline ticket on the booking website.
PPI — the Producer Price Index — measures what businesses pay. It captures prices at earlier stages of the supply chain: what manufacturers pay for raw materials and components, what wholesalers pay to distributors, what service firms pay for their inputs. It is the upstream number. The number that flows downstream into consumer prices with a lag.
The lag matters. Economists who study price transmission consistently find that changes in the PPI lead changes in the CPI by approximately 30 to 90 days. When producer prices spike, consumer prices follow — not immediately, but predictably, as businesses pass their higher input costs through to retail prices over the subsequent weeks and months.
This means Tuesday’s 3.8% CPI is a measurement of where prices were in April. Wednesday’s 6.0% PPI is a measurement of where prices are going between now and July.
Tuesday told you what happened. Wednesday told you what is coming.
The Number That Should Be Making Every Headline
Producer prices up 6.0% annually. 1.4% in a single month. The core reading — excluding food and energy, revealing underlying structural inflation — up 1.0% in a single month, 2.5 times the estimate.
Let those numbers sit alongside each other for a moment.
The Fed’s inflation target is 2% annually. Producer price inflation is running at 6% annually — three times the target — at the wholesale level, before it flows through to consumers. Core producer prices, which are supposed to be the more stable, structural measure of underlying inflation, rose 1.0% in a single month. Annualized, that is 12% core PPI inflation.
“Inflation is sticky and accelerating. The core reading confirms a deeper structural trend, especially in services,” said David Russell, global head of market strategy at TradeStation. “The Hormuz crisis is aggravating the problem, but this goes way beyond oil.”
That last sentence is the most important thing said about inflation this week.
The PPI report shows that the price pressures were broad-based. The services index accelerated 1.2%, the biggest monthly gain since March 2022. Two-thirds of the services move was attributed to a 2.7% rise in trade services — a sign that tariff costs are starting to have a larger impact on prices beyond the direct impact on goods. The move was also buttressed by a 3.5% jump in margins for machinery and equipment wholesaling.
This is not an oil story. Oil explains the energy component. Oil explains gasoline at $4.50 nationally. Oil explains jet fuel costs driving airline fares up 20.7% annually.
But services inflation at 1.2% monthly is not an oil story. Trade services inflation at 2.7% monthly is not an oil story. Machinery and equipment wholesaling margins up 3.5% is not an oil story.
These are structural inflation pressures — the kind that the Fed’s rate hiking cycle of 2022-2023 was supposed to have defeated. They are re-accelerating in 2026, driven partly by the Iran war and partly by tariff pass-through that is now moving through supply chains with enough lag that it is showing up in April data from tariffs announced months earlier.
The “Double Squeeze” Hitting Every American Household
Before the CPI and PPI data, a Bankrate analyst described what consumers are experiencing as a “double squeeze” — wrestling with both the acute pain of the gasoline price spike and the slow rise in other core budget items. The data from this week confirms and quantifies that description.
The acute pain — energy:
Gasoline prices are up 28.4% over the past twelve months. The national average is now $4.50 per gallon. In California, prices are above $5. Energy overall is up 17.9% annually — the steepest increase since September 2022. Fuel oil is up 54.3% annually.
These numbers represent a direct, unavoidable tax on every American who drives a car, heats a home with oil, or flies. They show up immediately in household budgets and cannot be managed with behavioral changes beyond the margins — most Americans cannot stop commuting, cannot stop heating their homes, cannot stop flying for essential travel.
The slow burn — everything else:
Food at home prices rose 0.7% in April alone — the biggest monthly gain since August 2022. Beef is up 14.8% over the year. Food overall is up 3.2% annually.
Shelter costs rose 0.6% in April — and this is where the report contains the most alarming signal for the inflation outlook. Shelter inflation had been decelerating in prior months. In April, it reaccelerated. Shelter is the single largest component of the CPI basket — it represents approximately 34% of the total index. When shelter inflation is decelerating, it pulls the overall number down. When it reaccelerates, as it did in April, it adds a persistent, sticky component that is extremely difficult to reverse quickly.
Airline fares rose 2.8% in a single month — putting the twelve-month gain at 20.7%. This is the direct pass-through of jet fuel costs, and it affects every American who travels for work, family events, or vacation. The consumer who budgeted their summer trip in January is now looking at ticket prices that are 20% higher than they were a year ago.
Apparel was up 0.6% for the month — the tariff effect flowing through clothing supply chains. Household furnishings and operations were up 0.7% — the tariff effect flowing through the furniture and home goods supply chains that depend heavily on Asian imports.
The “double squeeze” is not two separate problems. It is one problem — an inflation shock with both an acute energy component and a persistent, broadening structural component — expressing itself across nearly every category of household spending simultaneously.
39 Percent. That Is the Number That Changes Everything.
Before Tuesday’s CPI, markets were pricing a 25% probability of a Fed rate hike in 2026.
After Tuesday’s CPI, that probability rose to approximately 30%.
After Wednesday’s PPI — with its 1.4% monthly surge and 6.0% annual rate — that probability jumped to 39%.
39% probability of a rate hike.
This is the number that has not existed in serious market pricing for years. Since 2023, the debate has been entirely about when the Fed would cut rates, not whether it might raise them. The entire investment thesis of 2024 and early 2025 — own long-duration bonds, own growth stocks, own real estate — was built on the assumption that rate cuts were a matter of timing, not direction.
Wednesday’s PPI has placed serious institutional money on the possibility that the next Fed move is not a cut but a hike.
If the Fed raises rates from the current 3.5-3.75% range — in an economy where consumer confidence is at a 75-year low, the household survey is showing employment declines, and residential construction is contracting — the consequences are not theoretical. They are specific and painful.
Mortgage rates, already at 6.75-7%, would move toward 7.25-7.5%. Monthly payments on a $400,000 mortgage would increase by $150-200. The housing market, already struggling, would face further demand destruction.
Credit card rates, already at 22-24%, would increase further. The record $1.277 trillion in American credit card balances would generate more interest income for the banks and more payment burden for the families carrying those balances.
Business borrowing costs would rise. Companies with variable-rate debt — the most common structure for small and medium-sized businesses — would see their interest expenses increase immediately. Businesses operating on thin margins in sectors already squeezed by input cost inflation would face the additional pressure of higher financing costs.
39% is not a certainty. It is not even a majority position. But it is a serious institutional assessment that the inflation data of this week has moved the probability of a rate hike from theoretical to plausible. And plausible, in financial markets, moves asset prices.
What the PPI Says About June’s CPI
The 30-90 day transmission lag between PPI and CPI is well-documented in economic research. Using the April PPI data, it is possible to make a directional forecast about where CPI will be when the June 10 report covers May prices.
The PPI signals suggest that May and June CPI will face continued upside pressure from at least three channels.
Energy pass-through: The 1.4% monthly PPI gain was led by energy. That energy cost increase at the producer level has not yet fully passed through to retail prices. Gas station prices respond quickly, but utility bills, transportation costs, and the embedded energy cost in food production and distribution respond more slowly. The full energy pass-through from April’s PPI will still be flowing into May retail prices when the June 10 CPI report is released.
Services inflation persistence: The 1.2% monthly gain in services PPI — driven by trade services and warehousing — takes longer to transmit to consumer prices than goods inflation, but it is more persistent once it arrives. Service businesses build cost increases into contract renewals, subscription pricing, and periodic repricing cycles. The April services PPI surge will be showing up in consumer-facing services prices through May, June, and into the summer.
Tariff pass-through acceleration: Trade services PPI rising 2.7% in a single month suggests that tariff costs — which were expected to affect consumer prices gradually — are flowing through supply chains faster than some models projected. The April 2 pharmaceutical tariff announcement, the ongoing goods tariffs on most trading partners, and the secondary effects on logistics and distribution are all visible in the April PPI. These costs will continue to flow downstream in May.
The combination of these three channels suggests that the 3.8% CPI of April is more likely the beginning of a re-acceleration than a peak.
The next CPI report covers May prices and releases on June 10. Given the PPI data from this week, the probability that May CPI comes in above April’s 3.8% is meaningfully higher than the probability it comes in below it.
What Smart Money Is Doing With This Data
The institutional response to Tuesday’s CPI and Wednesday’s PPI has been consistent across the major macro funds and fixed income desks.
Selling duration. Long-duration Treasury bonds — 10-year, 20-year, 30-year — are most sensitive to inflation expectations. When inflation expectations rise, bond prices fall and yields rise. With PPI at 6% and rate hike odds at 39%, the trade is to reduce exposure to the bonds most vulnerable to yield increases and the asset price losses those increases produce.
Buying short-duration inflation protection. Short-term Treasury Inflation-Protected Securities — TIPS with 1-3 year maturities — provide direct inflation compensation without the duration risk of longer-term bonds. In an environment where inflation is re-accelerating and the Fed may hike, short-duration TIPS are the rare asset class that benefits from both the inflation and the rate increase simultaneously.
Maintaining energy exposure. The PPI data confirms what the CPI data showed: energy is the driver, and the Strait of Hormuz remains effectively closed. Oil back near $100, the Iran peace offer rejected Sunday, only 13 Strait crossings on Sunday. The macro condition that is generating PPI and CPI upside surprises has not changed. Energy sector equities that performed +37.91% in Q1 have the same fundamental tailwind in Q2.
Increasing cash and short-term instruments. With rate hike probability at 39% and the Fed’s next decision not until June 17 — Kevin Warsh’s first meeting — the uncertainty about the direction of rates argues for preserving optionality. Money market funds paying 4.8-5% annualized are providing real returns above core CPI in a world where core CPI is 2.8%. In a world where the next rate move might be a hike rather than a cut, locking into duration is a risk that the PPI data has made considerably more expensive to take on.
The Real Cost Running Through Every Receipt
Here is the personal finance translation of Tuesday’s and Wednesday’s numbers.
The American household spending $800 per month on groceries in January 2026 is spending approximately $825-835 per month in April — a monthly increase of $25-35, or $300-420 annually from food inflation alone.
The American commuting 15,000 miles per year in a vehicle getting 28 miles per gallon is spending approximately $800 more per year on gasoline than they were before the Iran war — based on the $1.50+ per gallon increase from pre-war prices.
The American with a summer flight booked is paying 20.7% more in airline fares than a year ago — on average $80-150 more per round trip depending on the route.
The American with a $500 monthly credit card balance is paying approximately $110 per month in interest at current 22% average rates — and if the Fed hikes, that 22% becomes 22.5% or 23%, adding $5-10 more per month.
Individually, none of these numbers is catastrophic. Together, for the American earning the median wage of approximately $56,000 annually (after tax: approximately $45,000), they represent $1,500-2,000 in additional annual costs — roughly 3.3% to 4.4% of after-tax income — from inflation alone, before any of the structural cost increases in rent, insurance, and healthcare that have been building for years.
Real average hourly wages slipped 0.5% for the month and fell 0.3% annually. The paycheck is not keeping pace with the price increases.
That is what the “double squeeze” means in household budget terms. That is what 3.8% CPI and 6.0% PPI means at the kitchen table.
The Week That Defined the Second Half of 2026
By Friday afternoon, between the CPI, the PPI, and the retail sales and import price data still to come Thursday, the macro picture for the second half of 2026 will be considerably clearer than it was a week ago.
What is already clear from Tuesday and Wednesday: inflation is not decelerating. It is re-accelerating at both the consumer and producer level. The war in Iran is a significant driver but not the only one — services inflation, tariff pass-through, and shelter costs are all contributing to a broadening of price pressures that goes beyond the energy shock.
The Fed’s impossible position — described in the Powell last-press-conference post — has not improved with this week’s data. It has deteriorated. The 39% rate hike probability is the market’s assessment of how much worse the impossible position has become since Wednesday morning.
Kevin Warsh takes the chair on Thursday, May 15. His first policy decision comes at the June 17 FOMC meeting — just under five weeks from now. He will have one more CPI report before that decision, covering May prices. If May CPI comes in above April’s 3.8%, given the PPI signals, his first meeting will be the most consequential debut for a new Fed Chair since Paul Volcker walked into the job in August 1979.
Volcker raised rates. Dramatically. Into a recession. And broke the inflation of the 1970s.
Whether Warsh is willing to do the same, with consumer confidence at a 75-year low and the household survey showing employment losses — is the question that 39 cents on every dollar in rate hike probability is currently asking.
This is not financial advice. Always consult a qualified financial advisor before making significant financial decisions. If this week’s inflation data surprised you — or confirmed what you’ve been feeling at the grocery store and the gas pump — share this with someone who only saw the CPI headline. The PPI is the number that tells you where prices are going next. And subscribe below for the next one.
Want to actually take action instead of just reading?
Most people understand what they should do with money — the problem is execution. That’s why I created The $1,000 Money Recovery Checklist.
It’s a simple, step-by-step checklist that shows you:
and how to start building your first $1,000 emergency fund without overwhelm.
where your money is leaking,
what to cut or renegotiate first,
how to protect your savings,
and how to start building your first $1,000 emergency fund without overwhelm.
No theory. No motivation talk. Just clear actions you can apply today.
If you want a practical next step after this article, click the button below and get instant access.
Every single day — including today, including yesterday, including every day since October — the United States Treasury has been writing a check for $3 billion.
Not $3 billion for defense. Not $3 billion for Social Security. Not $3 billion for roads, hospitals, schools, or the military.
$3 billion per day, every day, just in interest on money already borrowed. Money that produces nothing new. Money that buys no goods, funds no programs, and employs no one. Just the cost of carrying the debt that already exists.
The Congressional Budget Office released its monthly budget update on May 8. The headline number: the US Treasury has paid $628 billion in net interest in the first seven months of fiscal year 2026 — the seven months between October and April. That works out to $89.7 billion per month, $20.7 billion per week, $2.97 billion per day.
$3 billion a day.
For context: $628 billion in seven months for interest payments is more than the US has spent on Medicare in the same period. Medicare — the program that provides healthcare to 67 million elderly and disabled Americans — cost $588 billion in those seven months. The debt’s interest bill exceeded it by $40 billion.
The numbers are almost impossible to process at human scale. So let’s try a different frame. In the time it takes to read this sentence, the US Treasury paid approximately $104,000 in interest. By the time you finish this post, it will have paid more than $3 million.
Tomorrow morning at 8:30 AM, the Bureau of Labor Statistics releases the Consumer Price Index for April 2026. That number — one statistic, released in one moment — will determine whether the $3 billion daily interest burden gets worse over the coming months, or whether it has any path toward relief.
Here is why the connection matters, why almost nobody is explaining it clearly, and what Tuesday’s number actually means for the fiscal situation that is quietly consuming the American government’s capacity to function.
How Inflation and Debt Interest Are the Same Problem
Most people understand inflation and government debt as separate issues. Politicians discuss them separately. Economic reporters cover them separately. The Fed talks about inflation; Congress talks about the deficit; rarely do the two conversations converge into a single, coherent picture.
But they are not separate. They are the same problem, expressed in two different ways. And understanding how they connect is the most important thing you can know about the economic environment of 2026.
Here is the mechanism.
The United States carries approximately $29 trillion in debt held by the public — the portion of the $39 trillion total that is owned by investors, pension funds, foreign governments, and other market participants outside the government itself. That debt carries interest rates that range from near-zero (on bonds issued during the COVID era when rates were suppressed) to approximately 4.5-5% (on bonds issued in the current high-rate environment).
As the low-rate bonds mature — as the debt issued in 2020, 2021, and 2022 at 0.5-1.5% interest comes due — the Treasury must refinance it at current rates. A $1 trillion bond maturing at 1% interest that is refinanced at 4.5% interest generates approximately $35 billion in additional annual interest expense with no additional borrowing. The debt doesn’t grow; it just gets more expensive.
This is called “interest rate rollover risk.” And it is the primary mechanism by which the $628 billion in seven-month interest payments will continue to grow even if the government stops adding new debt tomorrow.
The CBO’s projections show interest costs rising from $628 billion in seven months to somewhere between $900 billion and $1 trillion for the full fiscal year 2026. By fiscal year 2035, the CBO projects interest payments exceeding $2 trillion annually — roughly double today’s pace.
Now here is where Tuesday’s CPI connects.
Inflation drives interest rates. When inflation is high, bond investors demand higher yields to compensate for the erosion of purchasing power. When inflation falls, yields can fall, and the rollover problem becomes less severe. When inflation rises, yields rise with it, and every Treasury bond that matures and gets refinanced locks in higher costs for the next 2, 5, 10, or 30 years.
The CPI print on Tuesday is not just about gas prices and grocery bills. It is about the trajectory of the interest rate at which the US government is rolling over $8-10 trillion in debt annually. Every 25 basis points of additional yield on that rollover represents approximately $20-25 billion in additional annual interest expense.
Tuesday’s number, in other words, will tell us how much more expensive the $3 billion daily interest burden is about to become.
What the Market Expects Tuesday — And Why It Matters
The consensus forecast for April CPI, based on Wall Street economist surveys, is approximately 3.2-3.4% year-over-year, with a monthly increase of approximately 0.3%.
If that forecast is accurate, it represents a modest improvement from March’s 3.3% annual rate and 0.9% monthly surge. The March number was heavily distorted by the initial oil price shock from the Iran war — gasoline prices jumped 21.2% in March alone. April’s gasoline prices stabilized somewhat as the ceasefire (however fragile) allowed some temporary relief. A lower monthly CPI in April would partly reflect that stabilization.
But the consensus forecast also comes with an unusual degree of uncertainty. The Iran war’s economic impact continues to ripple through supply chains, food prices, and energy costs in ways that are difficult to model precisely. The pharmaceutical tariffs announced on April 2 began to flow through drug prices in April. Shipping costs from Strait of Hormuz disruption affect goods prices with a lag of 60-90 days — meaning March’s disruption shows up in April-May retail prices.
The range of economist forecasts for Tuesday’s print spans from 2.8% to 3.7% annual — a genuinely wide range that reflects genuine uncertainty about which forces are dominating in the April data.
Here is what each scenario means.
If April CPI comes in below 3.0%:
A significant downside surprise would be the most positive development the Fed and the Treasury have seen in months. It would signal that March’s 0.9% monthly surge was indeed a temporary oil shock rather than the beginning of re-acceleration. Bond yields would likely fall, reducing the rollover cost for new Treasury issuance. The probability of a Fed rate hike — currently priced at roughly 25% by futures markets — would fall significantly. The daily interest burden would still be $3 billion, but the trajectory would shift toward relief rather than escalation.
If April CPI comes in between 3.0% and 3.5% (consensus):
An in-line result would produce limited market reaction. The Fed would remain on hold. Bond yields would remain elevated. The rollover cost would remain high. The $3 billion daily interest burden would continue on its current trajectory toward $1 trillion annually. The status quo — uncomfortable but not acute — would persist.
If April CPI comes in above 3.5%:
An upside surprise — driven by food price pass-through from the Strait disruption, pharmaceutical tariff impacts on healthcare costs, or service sector inflation that has proved persistent — would be the most damaging scenario for the debt trajectory. Bond yields would likely rise, increasing the rollover cost. The probability of a Fed rate hike would increase. The $3 billion daily interest figure would begin moving toward $3.5 billion, then $4 billion, as each new bond issuance gets refinanced at higher rates. The CBO’s projection of $2 trillion in annual interest by 2035 would look optimistic rather than alarming.
The Number Bigger Than Medicare That Nobody Is Discussing
The fiscal picture that the CBO’s May 8 update reveals deserves to be stated simply, because the individual numbers are so large that the overall picture gets lost.
The US government’s largest expenditure categories in the first seven months of fiscal year 2026:
Social Security: $953 billion
Medicare: $588 billion
Net interest on public debt: $628 billion
Medicaid: $409 billion
Defense: approximately $600 billion
Net interest on the public debt — $628 billion for seven months — now exceeds Medicare. It exceeds Medicaid by more than 50%. It is approaching defense spending.
This is a category of government expenditure that produces nothing for the American public. It does not feed anyone, heal anyone, defend anyone, or educate anyone. It is the price of past decisions — borrowing to fund tax cuts, stimulus programs, wars, and ongoing deficit spending — extracted in the present.
The deficit so far this year is actually smaller than it was for the same period a year prior — one of the few pieces of relatively positive fiscal news in the CBO update. But that improvement is occurring on top of a base interest burden that is already historically unprecedented in peacetime and that will grow regardless of current deficit trends as long as interest rates remain elevated.
Outlays for net interest on the public debt rose by $41 billion, or 7 percent, because the debt was larger than it was in the first seven months of fiscal year 2025.
A 7% year-over-year increase in interest payments. In a year when the government has a smaller deficit than the prior year. The interest burden is growing faster than efforts to control it, because the debt stock is large enough that even modest growth in the principal base generates significant interest cost increases at current rates.
The Structural Problem That Tuesday’s CPI Won’t Fix
Tuesday’s CPI print matters. But even a perfect, below-consensus reading won’t change the structural fiscal situation that the $3 billion daily number represents.
The structural problem is the relationship between the interest rate, the debt stock, and economic growth.
For a government’s debt to be sustainable — for the ratio of debt to GDP to remain stable or improve — the economy needs to grow faster than the real interest rate on its debt. When growth exceeds interest rates, the debt becomes smaller relative to the economy even without paying it down directly. This is the mechanism by which the United States reduced its debt-to-GDP ratio significantly after World War II — rapid economic growth outpaced interest costs.
Right now, the relationship is inverted. The real interest rate on US government debt (nominal yield minus inflation) is approximately 1-1.5%. The real GDP growth rate is approximately 0-1% after stripping out the one-time factors from Q1’s 2.0% nominal print. An economy growing at 0-1% in real terms, carrying debt at 1-1.5% real rates, is in a situation where the debt ratio grows even with no new borrowing.
The CBO director told Fortune earlier this year that “productivity is massively the most important thing” for the long-term fiscal outlook. If AI generates the productivity gains that the $650 billion annual capex commitment is predicated on — if the economy grows at 3-4% real rates as AI-driven productivity compounds — the fiscal picture changes dramatically. The debt becomes manageable. The $3 billion daily interest payment becomes a smaller share of a much larger economic base.
If AI doesn’t deliver those gains — if the productivity revolution takes longer than the investment cycle assumes, or doesn’t materialize at the scale projected — the fiscal picture becomes increasingly difficult. The interest payments grow. The debt ratio grows. The government’s capacity to respond to the next crisis — war, pandemic, recession — becomes increasingly constrained.
Tuesday’s CPI is one data point in that larger story. It is the most important single data point of the week. But it is one data point.
Iran, the Strait, and the Interest Bill
There is a direct line from the Strait of Hormuz to the US Treasury’s interest payment.
It runs like this.
The Strait of Hormuz remains effectively closed. Oil is back near $100 after the peace offer was rejected Sunday — Iran held the same demands it had made previously, including reparations and control over the Strait. Trump rejected it. Only 13 Strait crossings occurred on Sunday, 3 on Saturday. Flows remain at a trickle.
As long as oil is near $100, inflation stays elevated. As long as inflation stays elevated, the Fed cannot cut rates. As long as the Fed cannot cut rates, Treasury bond yields remain near 4.3-4.5%. As long as yields remain near 4.3-4.5%, every bond that matures and is refinanced locks in higher interest costs than the bond it replaces. As long as each bond locks in higher costs, the annual interest burden grows.
The $628 billion in seven months becomes $950 billion for the full year. Then $1.1 trillion. Then, as the CBO projects, $2 trillion by 2035.
The Strait of Hormuz and the US Treasury’s interest bill are connected by the same chain. It takes about four steps to trace the connection. But it is a direct causal chain, not a correlation.
Tuesday’s CPI is one measurement of where that chain currently stands. Is oil’s inflation already flowing fully through into core prices? Or is the pass-through still incomplete, with more to come in May and June?
The answer to that question — expressed as a single percentage at 8:30 AM Tuesday — will shape the trajectory of the $3 billion daily interest burden for the next six months.
What To Watch This Week Beyond CPI
Tuesday’s CPI is the main event. But the week’s data calendar is unusually rich for anyone tracking the intersection of inflation and fiscal pressure.
Wednesday: PPI (Producer Price Index). The Producer Price Index measures inflation at the wholesale level — the prices that businesses pay before they pass costs to consumers. PPI tends to lead CPI by 30-60 days. A high PPI on Wednesday signals that whatever Tuesday’s CPI shows, more inflation is in the pipeline. A low PPI suggests the pass-through is moderating.
Thursday: Import prices, jobless claims, retail sales. Import prices measure inflation arriving from overseas — including from the supply chains disrupted by the Strait closure and affected by tariff pass-through. Retail sales show whether the American consumer is still spending despite the inflation squeeze. Jobless claims will update the labor market picture from the confusing April report. All three in one day.
Friday: Industrial production. The health of the manufacturing sector, which has been in the ISM’s expansion territory for four consecutive months but faces headwinds from trade uncertainty and input cost inflation.
The week’s data, taken together, will be the most comprehensive single-week read on the American economy since the quarter began. By Friday afternoon, the picture of whether the Iran war’s economic damage is stabilizing or accelerating will be considerably clearer than it is today.
The Bottom Line for May 11, 2026
The United States Treasury paid $628 billion in interest in the first seven months of fiscal year 2026 — $3 billion per day, more than it spent on Medicare. Powell’s term as Fed Chair ends Thursday, May 15. Kevin Warsh takes over with an inflation mandate that the $3 billion daily figure makes impossible to compromise on. Iran rejected the peace offer Sunday and Trump rejected their counter. Oil is back near $100. The Strait is at a trickle.
Tomorrow morning at 8:30 AM, one number will tell us whether this situation is stabilizing or accelerating.
The number that matters is not the headline. It is whether core CPI — the measure that strips out food and energy and reveals the underlying inflation that monetary policy is supposed to address — is above or below the prior month’s reading.
If core CPI is decelerating: the bond market exhales, yields fall modestly, the rollover cost pressure moderates, Warsh inherits a slightly more manageable situation.
If core CPI is accelerating: yields rise, rate hike probability increases, the rollover cost accelerates, and the $3 billion daily number begins moving toward $3.5 billion.
$3 billion per day. Every day. Just in interest.
Tomorrow morning, we find out if that’s the floor or the ceiling.
This is not financial advice. Always consult a qualified financial advisor before making significant financial decisions. If this helped you understand why tomorrow’s inflation number matters beyond your grocery bill — share it before 8:30 AM Tuesday. The number that shapes the US government’s finances for the next decade drops in less than 24 hours. And subscribe below for the next one.
Want to actually take action instead of just reading?
Most people understand what they should do with money — the problem is execution. That’s why I created The $1,000 Money Recovery Checklist.
It’s a simple, step-by-step checklist that shows you:
and how to start building your first $1,000 emergency fund without overwhelm.
where your money is leaking,
what to cut or renegotiate first,
how to protect your savings,
and how to start building your first $1,000 emergency fund without overwhelm.
No theory. No motivation talk. Just clear actions you can apply today.
If you want a practical next step after this article, click the button below and get instant access.
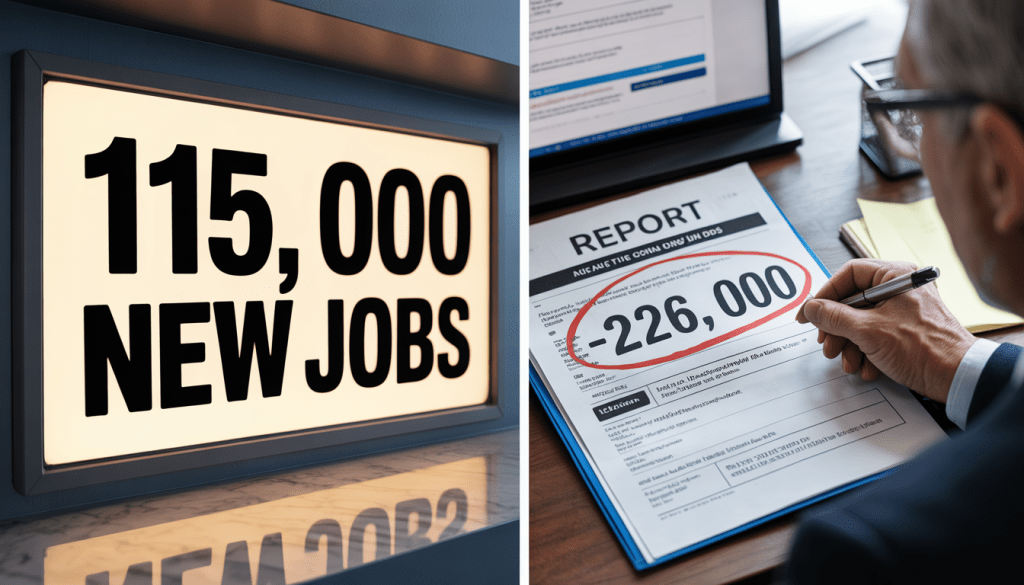
This morning, the Bureau of Labor Statistics released the April jobs report.
The headline number was 115,000 new jobs. Better than the 55,000 consensus. Unemployment unchanged at 4.3%. Markets breathed. Anchors said “resilient.” The word “solid” appeared hundreds of times in financial news coverage within the hour.
And buried in the same report — released at the exact same moment, from the exact same agency — was a different number.
Negative 226,000.
Not 115,000 new jobs. Minus 226,000 workers. A loss. In April.
Both numbers are real. Both are official. Both come from the Bureau of Labor Statistics. They measure slightly different things, using slightly different methodologies, and they have never diverged this sharply for this many consecutive months without it eventually meaning something important.
The 115,000 is the number that will trend. The -226,000 is the number that will explain why, six months from now, the economy looks worse than today’s headlines suggested.
Here is what is actually happening inside the April jobs report that nobody is explaining clearly.
Two Surveys. Two Completely Different Stories.
The monthly jobs report contains data from two separate surveys conducted by the BLS. Most people don’t know this. Most financial coverage doesn’t explain it clearly enough. And the divergence between them, in April 2026, is the most important story in today’s data.
The Establishment Survey — the one that produced +115,000 — surveys approximately 119,000 businesses and government agencies. It asks employers how many people are on their payroll. It is the source of the headline number. It is the most widely reported figure. It tends to be more stable month-to-month but is subject to significant revisions (as documented in the previous post’s -911,000 benchmark revision discussion).
The Household Survey — the one that produced -226,000 — is a separate survey of approximately 60,000 households. It asks people directly whether they are employed, unemployed, or not in the labor force. It is the source of the unemployment rate. It tends to be noisier month-to-month but captures important dimensions of labor market reality that the establishment survey misses: the self-employed, agricultural workers, private household workers, and — critically — people who work multiple jobs (counted once in the household survey, multiple times in the establishment survey).
In a functioning, stable labor market, the two surveys tell roughly the same story over time. Month-to-month divergences are normal. But sustained divergence — the household survey consistently painting a darker picture than the establishment survey — is a warning signal that experienced labor market analysts take seriously.
The household survey has now shown a loss of employment in every single month of 2026. January, February, March, April — four consecutive months of household survey employment declines. The establishment survey has shown gains in every month except February.
Four consecutive months of divergence in the same direction is not statistical noise. It is a pattern. And the pattern says: the people being surveyed are telling the BLS they don’t have jobs at the same time that the businesses being surveyed are telling the BLS they have workers on payroll.
The 3-Month Average That Changes Everything
When the April headline of +115,000 is announced, it will be compared to the prior month’s +185,000 (March, after upward revision). The month-over-month comparison looks fine. Slower, but positive.
But the three-month rolling average — which smooths out the extraordinary month-to-month volatility that has characterized 2026 labor data — tells a completely different story.
Revisions pulled down the three-month average for job gains to 48,000 per month.
48,000 per month. That is the actual pace of job creation in the United States, averaged across the past three months including today’s revisions.
For context: economists estimate that approximately 100,000-120,000 new jobs per month are needed to absorb new labor force entrants and keep the unemployment rate stable — given current labor force growth constraints from demographics and immigration policy. A three-month average of 48,000 is less than half the breakeven rate.
An economy creating jobs at less than half the rate needed to keep pace with labor force growth should, in theory, be producing a rising unemployment rate. The unemployment rate is not rising — it is holding at 4.3%.
Why? Because the labor force is shrinking. People are leaving. They are not being counted as unemployed because they have stopped looking for work. And when people stop looking for work, they fall out of the unemployment calculation entirely.
This is the most important number in today’s report that is receiving almost no attention.
The labor force participation rate has declined from 62.6 to 61.8 percent. The labor force — the total number of people either employed or actively looking for work — has declined by more than 1 million. And the number of people employed has declined by more than 1.2 million.
The labor force shrank by over a million people. The number of employed people fell by over 1.2 million. These are the household survey numbers. They describe an America where people are not losing their jobs in mass layoffs — they are quietly leaving the workforce entirely.
The Real Unemployment Rate: 8.2%
The headline unemployment rate is 4.3%. That number gets the attention, the graphic, the anchor’s commentary.
But the BLS produces a second, broader unemployment measure every month — the U-6. It is not hidden. It is published in the same report. It includes, in addition to the officially unemployed, two additional groups that the headline rate excludes: marginally attached workers (people who want jobs and have looked in the past year but not in the past four weeks) and people working part-time for economic reasons (people who want full-time jobs but can only find part-time work).
The U-6 measure, now at 8.2%, captures some of this shift in individuals leaving the labor force.
8.2% is the real unemployment rate. The one that counts the people who have given up looking. The one that counts the people who took a part-time job because they couldn’t find a full-time one.
That is two full percentage points above what we saw in 2019.
In 2019, the labor market was considered historically strong. Economists were using phrases like “the best job market in 50 years.” U-6 was around 6.2%.
Today, with the headline unemployment rate matching 2019 levels (4.3%), the U-6 is two full percentage points higher. That gap — between the headline rate and the broader reality — represents millions of Americans who are counted as “not unemployed” but are clearly not experiencing the labor market conditions that the headline number implies.
Those who were forced to accept part- instead of full-time work rose by 445,000 in April alone.
445,000 Americans moved from full-time employment to involuntary part-time in a single month. These are workers who did not lose their jobs in the technical sense — they are still employed, still counted in the headline 115,000 — but whose income, hours, and economic security deteriorated significantly.
The AI Job Destruction Nobody Is Naming Directly
Buried in the sector breakdown of today’s report is a data point that should be generating considerably more discussion than it is.
Information services lost 13,000 jobs in April, part of a continuing trend that has seen the category down 342,000 jobs since November 2022, coinciding with the rise of artificial intelligence.
342,000 jobs lost in information services since November 2022. The timing is not ambiguous — November 2022 is when ChatGPT launched and the generative AI era began in earnest. The information services sector, which includes software publishing, data processing, and other technology-adjacent roles that are most directly exposed to AI substitution, has lost 342,000 jobs in the same period that the largest technology companies in the world have been deploying AI across their operations.
These are not manufacturing jobs, not retail jobs, not hospitality jobs. These are white-collar, knowledge-economy jobs — the category that was supposed to be safe from automation, that was supposed to benefit from AI as an assistive tool rather than being replaced by it.
342,000 jobs in one sector. Over 30 months. At an accelerating pace.
The White Collar Bloodbath post in this series, published in March, documented the wave of AI-driven layoffs at McKinsey, Salesforce, Microsoft, Nvidia, and other major employers. Today’s BLS data is the first official government confirmation that the pattern is real and is showing up in aggregate employment statistics.
Information services employment down 342,000 since AI launch. Not a forecast. An official government measurement.
Who Is Actually Leaving the Labor Force
The labor force participation rate fell to 61.8% in April — the lowest since October 2021. More than 1 million people left the labor force in a year. The question of who is leaving is as important as the fact that they are leaving.
Men over the age of 55 and prime age women — those 25 to 54 — accounted for the losses.
Two distinct groups. Two entirely different reasons.
Men over 55: Early retirement, voluntary and involuntary. In a labor market where knowledge-economy jobs are being eliminated by AI and knowledge-economy workers over 55 face significant age discrimination in re-employment, the choice between continued job searching and early retirement is not always voluntary. Many of the men leaving the labor force are not choosing leisure — they are accepting that re-employment at comparable compensation is unlikely and taking the Social Security and pension income available to them.
Prime age women (25-54): The childcare and return-to-office collision.
Prime age women with a bachelor’s degree or higher and small children at home have been dropping out of the labor force entirely in response to the high costs of childcare and return-to-office mandates.
This is one of the most consequential economic trends in the current data — and it is almost entirely invisible in the headline number.
Childcare costs have risen to the point where the math of working full-time while paying for childcare is, for many families, negative. A family with two young children in a major metropolitan area can face childcare costs of $3,000-4,000 per month. For a parent earning $60,000-75,000 annually, the post-tax income net of childcare is close to zero — or actually negative after commuting and other work-related costs.
Simultaneously, the return-to-office mandates that major employers have implemented in 2025-2026 have eliminated the flexibility that made dual-income households with young children mathematically viable. Remote work allowed a parent to be geographically available during school pickup windows, sick days, and school closures without burning vacation time. The elimination of remote flexibility, in a world of $3,000-4,000 monthly childcare costs, is pushing prime-age women out of the workforce in a pattern that the April data makes visible.
The eldercare market is in crisis. Men make up almost half of all unpaid elder care providers.
The men over 55 who are leaving the labor force are not only retiring. Many are becoming unpaid caregivers for aging parents in a healthcare system where professional elder care is increasingly unaffordable. This is the hidden demographic crisis inside the labor force participation rate.
Federal Employment: Down 348,000 From Peak
Federal employment is now down 348,000 jobs from its peak in October 2024. Staffing shortages have become acute at some federal agencies; older workers took buyouts, early retirement and quit in the wake of last year’s cuts.
348,000 federal jobs eliminated since October 2024. This is the DOGE effect made numerical and official.
The cuts are not evenly distributed. They are concentrated in regulatory agencies, research institutions, social service administration, and the federal workforce that implements programs — not the military or law enforcement functions that have been protected or expanded.
The consequences of this concentration are beginning to show up in ways that the employment statistic doesn’t capture. Staffing shortages at the Social Security Administration affect processing times for disability and retirement claims. Shortages at the Veterans Administration affect service delivery to veterans. Shortages at the FDA affect drug approval timelines — the same FDA that is simultaneously being asked to certify new US pharmaceutical manufacturing facilities in the context of the pharmaceutical tariff transition.
The 348,000 federal job losses are in the headline establishment survey. They are one reason the overall headline looks worse than it might otherwise — federal employment has been a persistent drag on an otherwise positive private sector picture.
But the economic impact of those 348,000 jobs extends well beyond the employment statistic. The services those workers provided don’t stop being needed just because the workers are gone.
The Housing Market Signal Hidden in Plain Sight
The residential building construction sector lost 1,500 jobs and residential specialty trade contractors shed 8,900 positions. Real estate also lost jobs in April, with employment falling by 1,700 jobs, while rental and leasing services employment fell by 3,600 jobs.
These are small numbers relative to the 115,000 headline. But they are directionally significant.
Residential construction employment falling — in a month that should be seeing seasonal strength as spring building season begins — signals that homebuilders are pulling back on activity. With mortgage rates at 6.75-7%, the economic math of homebuilding has deteriorated. Builders who started projects at lower rates are completing them. New project starts are declining.
Real estate employment falling — agents, brokers, property managers — reflects the transaction volume collapse that accompanies high mortgage rates. Fewer transactions mean less commission income, which means fewer employed real estate professionals. The housing market contraction that the MBA has been documenting for months is now showing up in employment data.
The Fed’s “higher for longer” policy, maintained to fight the inflation that the Iran war has re-accelerated, is producing a housing market contraction that is measurable in construction and real estate employment. The homebuyer who is waiting for rates to fall is waiting for a Fed that cannot cut. And the workers who depend on housing market activity are feeling the consequences.
What The Numbers Together Actually Say
The April 2026 jobs report, read in full, says this:
The establishment survey shows 115,000 new hires — employers adding workers to payrolls at a rate better than consensus, concentrated in healthcare, transportation, and retail.
The household survey shows 226,000 fewer employed people — workers reporting to surveyors that they don’t have jobs, even as employers report them on payrolls.
The labor force shrank by over a million people over the past year. The people leaving are not being counted as unemployed. The unemployment rate holds at 4.3% not because the labor market is strong but because the denominator — the number of people looking for work — is falling.
The U-6 “real” unemployment rate is 8.2%. Two percentage points above 2019. 445,000 Americans moved from full-time to involuntary part-time in April alone.
Information services has lost 342,000 jobs since AI launched in November 2022. Federal employment is down 348,000 from its October 2024 peak. Residential construction and real estate shed jobs in what should be the spring building season.
The three-month average payroll gain — after today’s revisions — is 48,000. Less than half the breakeven rate.
This is the jobs report that the headline number is not describing. Both are true. The 115,000 is real. The rest of this is also real.
The question is which truth more accurately describes the economic experience of the 160 million Americans in the labor force.
The consumer confidence data — at a 75-year low — suggests they have already voted on that question.
This is not financial advice. Always consult a qualified financial advisor before making significant financial decisions. If this gave you a clearer picture of what was actually inside this morning’s jobs report beyond the headline — share it with someone who heard “115,000” and thought the economy was fine. And subscribe below for the next one.
Want to actually take action instead of just reading?
Most people understand what they should do with money — the problem is execution. That’s why I created The $1,000 Money Recovery Checklist.
It’s a simple, step-by-step checklist that shows you:
and how to start building your first $1,000 emergency fund without overwhelm.
where your money is leaking,
what to cut or renegotiate first,
how to protect your savings,
and how to start building your first $1,000 emergency fund without overwhelm.
No theory. No motivation talk. Just clear actions you can apply today.
If you want a practical next step after this article, click the button below and get instant access.
This morning at 8:30 AM Eastern, the Bureau of Labor Statistics will release the April 2026 jobs report.
Markets will react. Anchors will comment. The headline number will trend. Everyone will form an opinion about whether the economy is strong or weak based on a single number released at a single moment.
But before you read that number — before you decide what it means — there is something you need to understand about the numbers that came before it.
Last month, buried in the technical footnotes of the March employment release, the Bureau of Labor Statistics published a sentence that deserved front-page coverage and received almost none.
The preliminary benchmark revision for March payroll employment is -911,000 (-0.6%).
Nine hundred and eleven thousand jobs. Gone. Not lost — never there. They were in the official monthly reports. They were cited by economists and politicians and financial media as evidence of labor market strength. They were the basis for Federal Reserve decisions about interest rates. They were the numbers that shaped the narrative about the American economy throughout 2025.
And they were wrong. The government overcounted employment by 911,000 people.
Today’s April report will generate enormous coverage. This context will generate almost none. That gap is the most important thing to understand about the jobs data you’re about to read.
What a Benchmark Revision Actually Is — And Why This One Matters
Every spring, the Bureau of Labor Statistics conducts what it calls a “benchmark revision” — a comprehensive reconciliation of its monthly employment estimates against complete payroll tax records from state unemployment insurance systems. This is the definitive count. It covers every employer, every payroll, every W-2 filed in the United States.
The monthly jobs reports — the ones that move markets and dominate headlines — are estimates. They are based on surveys of approximately 119,000 businesses representing about 26% of nonfarm payroll jobs. The estimates are constructed using statistical models and seasonal adjustment factors. They are the best available real-time approximation of what is happening in the labor market.
The benchmark revision is the correction that happens when the approximation meets the reality.
The -911,000 preliminary revision means that between April 2024 and March 2025, the BLS overestimated employment by 911,000 workers. On a base of approximately 158 million nonfarm payroll jobs, that is a 0.6% overcount — within the BLS’s stated margin of error, technically acceptable, but economically significant.
Here is why it matters beyond the statistical footnote.
The Federal Reserve made interest rate decisions based on this data.
Throughout 2025, as the Fed was navigating whether to cut rates and by how much, the official employment numbers showed a labor market that was stronger than it actually was. The FOMC members who voted on rate decisions were looking at employment figures that were overstated by nearly a million workers.
A million workers is not a rounding error. It is the difference between a labor market that is genuinely resilient and one that was softer than the reported numbers suggested. It is the difference between an economy that can absorb higher rates without significant damage and one that was already under more stress than the data indicated.
The Fed cut rates three times in late 2025. Would those decisions have been different — perhaps more aggressive, cutting sooner or by more — if the employment data had been accurate in real time? Nobody can say with certainty. But the question matters because the policy decisions compound. Rate decisions made in late 2025 based on data that was subsequently revised by 911,000 workers shaped the economic conditions that the Iran war then hit in early 2026.
This Is Not the First Time. It’s Getting Worse.
The -911,000 revision is large. But it is not unprecedented. It follows a pattern that has been building for several years.
In 2024, the BLS’s preliminary benchmark revision showed that the prior year’s employment had been overstated by 818,000 workers — the largest downward revision since 2009.
In 2023, the revision was smaller — approximately 300,000 — but still directionally negative.
In 2022, another negative revision of several hundred thousand.
The pattern is consistent: for four consecutive years, the monthly employment estimates have overstated actual employment, and the annual benchmark revision has corrected the overcount downward. Every year, the narrative of labor market strength that was built on the monthly estimates has been quietly revised to reflect a reality that was somewhat weaker than advertised.
Why is this happening systematically? The explanations that labor statisticians offer are technical: changes in birth/death model adjustments, difficulty capturing employment in new business formations, challenges measuring gig economy and contract work that doesn’t show up cleanly in traditional payroll survey frameworks.
But the systematic directionality — always overstating, never understating, for four consecutive years — is harder to explain purely on technical grounds. A random measurement error would produce revisions in both directions roughly equally. Four consecutive years of overstatement suggests a structural bias in the methodology that is consistently producing numbers that are too strong.
That structural bias has consequences. It creates an economy that looks stronger in real time than it is. It creates a Fed that may be acting on a more optimistic employment picture than the eventual data supports. And it creates a public narrative about economic health that is consistently revised downward months after the fact, when the corrections receive a fraction of the attention given to the original releases.
February Was Revised to -133,000. That Should Be a Bigger Story.
The benchmark revision covers a long period. But the most recent monthly revision — what the BLS does every month when it adjusts prior months as new data comes in — produced a number that deserves specific attention.
The February 2026 employment report was revised from the originally reported figure to -133,000 jobs. A loss of 133,000 jobs in a single month.
The original February report — the one that made headlines — showed a significant decline but was understood as partly war-related, partly seasonal. The revised figure of -133,000 is considerably worse than the original reading.
For context: in the entire post-COVID expansion, monthly job losses of this magnitude have occurred only during specific acute shocks — the initial COVID collapse, the post-reopening volatility of 2021-2022. A -133,000 month in February 2026 is a genuine labor market contraction, not a rounding error.
January was revised upward by 34,000 — to +160,000 — which partially offsets the February deterioration. But the combined January-February picture is 7,000 jobs lower than previously reported. And the trend embedded in those revisions — a strong January followed by a sharp February contraction — describes a labor market that hit the Iran war in a more fragile state than the original numbers suggested.
The April Consensus: A Number That Reveals the Uncertainty
Today’s April jobs report arrives with an unusually wide range of forecasts from Wall Street economists — itself a signal about how uncertain the underlying picture is.
The consensus estimate is approximately 55,000 to 165,000 jobs, depending on which economist’s forecast you weight most heavily. That is an extraordinary spread. A 110,000-job range in a monthly forecast reflects genuine disagreement about the state of the labor market — disagreement that stems directly from the noisy, frequently revised data environment described above.
Wells Fargo economists estimate total payrolls advanced 70,000. Bank of America forecasts 80,000. Fifth Third Commercial Bank forecasts 120,000. The range across major institutional forecasters spans from 50,000 to 165,000.
The wide spread has a specific explanation. The March report — at +178,000 — significantly beat expectations, which themselves were clustered around 50,000-100,000. After a beat of that magnitude, forecasters are divided between those who expect a snapback lower and those who think March represents the start of a more durable acceleration.
Wednesday’s ADP private payrolls report — a different measure that covers only private sector employment — came in at 109,000, beating the 84,000 consensus estimate. Job creation was concentrated in education and health services, which added 61,000. Small companies with fewer than 50 employees added 65,000.
ADP’s chief economist described the result as “small and large employers are hiring, but we’re seeing softness in the middle” — a characterization that describes a labor market bifurcation that mirrors the broader economic K-shape this series has documented throughout the Iran war period.
A strong beat could reignite Fed rate hike bets. Traders currently price in a 25% chance of a rate hike in 2026.
That last sentence deserves to stand alone. A 25% probability of a rate hike — not a cut, a hike — in an economy where consumer confidence just hit a 75-year low. That is the Fed’s impossible position made numerical.
The Real Wages Story Nobody Is Leading With
Beyond the headline payroll number, there is a data series in the March employment report that received almost no coverage and that is more important for understanding the financial condition of American households than any jobs count.
Real average hourly earnings for all employees decreased 0.6 percent in March, seasonally adjusted.
Nominal wages increased 0.2 percent. CPI-U increased 0.9 percent. The difference — negative 0.7 percentage points — is the real wage destruction that happened in a single month.
Real average weekly earnings decreased 0.9 percent.
These are not annualized numbers. These are single-month declines in the purchasing power of the American worker’s paycheck. In March alone — driven by the 0.9% monthly CPI surge that the Iran war’s oil shock produced — the average American worker became measurably poorer despite receiving a nominal pay increase.
This is the mechanism behind the paradox documented in the previous post in this series: the 50-year-low in jobless claims coexisting with the 75-year-low in consumer confidence. People have jobs. Their paychecks are larger in nominal terms. Their purchasing power is falling in real terms. The job market statistic says strength. The real wages statistic says deterioration. Both are true simultaneously.
The April jobs report will show nominal wage growth. Watch the real wage figure — the number that adjusts for CPI. That number, not the headline payroll count, is the one that describes what is actually happening to the financial lives of working Americans.
What A Strong Number Means. What A Weak Number Means. What Both Mean.
The April jobs report will produce one of three broad outcomes and it is worth understanding what each one means before the number drops.
If April comes in above 150,000:
A beat would be interpreted as evidence of labor market resilience despite the Iran war. Markets would likely sell off on the news — because a strong jobs number makes Fed rate cuts less likely. Specifically, it would increase the probability of the “higher for longer” scenario that has been weighing on rate-sensitive sectors (technology, real estate, consumer discretionary) throughout the first quarter.
The irony of a strong jobs number pushing markets lower is the defining feature of the current economic environment. Normally, good economic data is good for markets. In a world where the Fed cannot cut rates and may need to hike them, good economic data removes the last remaining justification for rate relief.
The 25% market probability of a rate hike would likely increase on a strong beat.
If April comes in between 50,000 and 150,000:
An in-line result — consistent with the broad consensus range — would likely produce muted market reaction. It confirms the “low hire, low fire” labor market that has characterized the past two years without providing decisive evidence for either the optimistic or pessimistic scenario. The Fed’s impossible position remains unchanged. Rate uncertainty persists.
If April comes in below 50,000 — or negative:
A significant miss would reignite recession fears that have been building but not yet confirmed by official data. It would be the first piece of hard payroll data suggesting that the Iran war’s economic damage is moving beyond energy prices and consumer sentiment into actual job destruction.
A miss of this magnitude — combined with the -133,000 February revision, the 0.5% Q4 GDP, the potentially weak Q1 private sector growth, and the 75-year consumer sentiment low — would create the most compelling argument yet for emergency Fed action. But with core PCE at 4.3% and inflation expectations at 4.8%, “emergency action” in the form of rate cuts remains deeply problematic.
A weak April number in this specific inflation environment creates the possibility of the most difficult monetary policy decision in decades: whether to cut rates in a recession while inflation is running well above target.
The Three-Month Average That Tells the Real Story
Beyond today’s single-month April print, the number that matters most for understanding labor market trajectory is the three-month average of payroll growth.
Three-month average: approximately +68,000 per month.
68,000 per month is below the breakeven rate — the number of jobs needed to absorb new labor force entrants and keep the unemployment rate stable. Economists estimate that breakeven is approximately 100,000-120,000 per month given current labor force growth rates constrained by immigration policy changes and demographics.
If April comes in near the 55,000-80,000 range that the more cautious forecasters project, the three-month rolling average falls further below breakeven. The unemployment rate — currently at 4.3% — would begin drifting toward 4.5% and higher in subsequent months.
An unemployment rate moving consistently from 4.3% toward 4.5% and then 4.7% is not a catastrophe in isolation. But in the context of a war-driven inflation shock, a Fed that cannot cut rates, record consumer debt, and the worst consumer confidence in 75 years — it is the piece of the picture that converts all of the other warning signs from potential risk to confirmed deterioration.
What To Watch At 8:30 AM — And What The Number Won’t Tell You
When the number drops this morning, here is what to look for beyond the headline.
The headline payroll count. Yes, obvious — but note the range of estimates and where the actual print falls relative to the full range, not just the median consensus. A miss relative to the most optimistic forecast is a different signal than a miss relative to the median.
The revisions to March and February. March’s +178,000 was strong and may be revised lower, as previous months have been. February’s already-revised -133,000 may be revised further. The revision pattern over the past four years has been consistently downward — meaning today’s strong months often look weaker in subsequent reports.
Real average hourly earnings. Not the nominal number. The real number — nominal earnings growth minus CPI. This is the number that tells you whether the workers keeping their jobs are getting richer or poorer in purchasing power terms.
The government employment line. Federal employment has been declining as DOGE-related cuts flow through. Today’s number will show another month of federal employment contraction. Watch whether state and local government employment is offsetting federal declines, or whether the government sector as a whole is becoming a headwind to the headline number.
The unemployment rate. 4.3% is the current figure. Any movement above 4.3% — even to 4.4% — will receive outsized attention in a market that is already pricing a 25% probability of a rate hike and needs any evidence of economic softening to push that probability lower.
What the number won’t tell you: whether it is accurate. The benchmark revision pattern of the past four years suggests that today’s release — whatever it says — will be revised, probably downward, in subsequent months. The 911,000 job overcount in the prior year’s data is a reminder that the number printed at 8:30 AM is a best estimate, not a final count.
By the time the final count arrives, the market will have already moved on the estimate.
That is how economic data drives financial markets. And understanding that the estimate is systematically biased in a specific direction is the edge that most people reading the headline number don’t have.
The Bottom Line Before 8:30 AM
The April jobs report matters. Read it. Understand it. Form a view.
But read it knowing that the preliminary benchmark revision of -911,000 means the government overcounted jobs by nearly a million in the prior year. That February was revised to -133,000 — a genuine monthly contraction that got far less attention than the original release. That real wages fell 0.6% in March despite nominal wage gains. That the unemployment rate needs to be watched for the first sign of drift above 4.3%.
And read it knowing that the number released this morning will almost certainly be revised in subsequent months — and that the revision pattern of the past four years runs consistently in one direction.
The headline is coming. The context is what you just read.
Want to actually take action instead of just reading?
Most people understand what they should do with money — the problem is execution. That’s why I created The $1,000 Money Recovery Checklist.
It’s a simple, step-by-step checklist that shows you:
and how to start building your first $1,000 emergency fund without overwhelm.
where your money is leaking,
what to cut or renegotiate first,
how to protect your savings,
and how to start building your first $1,000 emergency fund without overwhelm.
No theory. No motivation talk. Just clear actions you can apply today.
If you want a practical next step after this article, click the button below and get instant access.
This is not financial advice. Always consult a qualified financial advisor before making significant financial decisions. If this gave you a clearer lens for reading this morning’s jobs number — share it before 8:30 AM. The number everyone will see is already known to be an estimate. Understanding its limitations is the difference between reacting and thinking. And subscribe below for the next one.
In a single year. From five companies. On one technology.
That is larger than the GDP of Sweden. Larger than the GDP of Poland. Larger than the entire annual economic output of Argentina, with enough left over to buy every NFL team at current valuations and still have change.
Microsoft, Alphabet, Meta, Amazon, and Apple all reported Q1 2026 earnings on April 29 and April 30. Every single one of them raised their AI infrastructure spending guidance for the year. The combined 2026 capital expenditure commitment from the five hyperscalers is now tracking $650 to $700 billion — the largest concentrated infrastructure investment cycle in the history of corporate capitalism.
For context: the entire Marshall Plan — the program that rebuilt Europe after World War II — cost approximately $173 billion in today’s dollars. Five technology companies are spending nearly four times that amount this year alone, on data centers, chips, and AI infrastructure.
The scale is almost impossible to process. But the question buried inside that scale is one of the most important in finance right now — and it is not being asked loudly enough.
What if the revenue doesn’t catch up?
What Each Company Announced — And What It Actually Means
The earnings calls on April 29 produced a set of data points that, taken together, tell the most important story in technology investing right now.
Alphabet: Revenue of $109.9 billion in Q1 — up 22% year over year, its highest growth rate since 2022. Google Cloud grew 63% to $20 billion, demolishing analyst estimates of $18 billion. The CEO said Google is currently “compute constrained” — meaning customer demand for AI infrastructure exceeds what Alphabet’s data centers can currently supply. Full-year 2026 capex guidance raised to $180-190 billion, up from the prior $175-185 billion range. CFO Anat Ashkenazi said 2027 capex will “significantly increase” compared to 2026.
The Alphabet story is the best one in the group. Cloud revenue accelerating at 63% year-over-year, with a backlog that nearly doubled quarter-over-quarter to over $460 billion, suggests that the infrastructure spending is converting into customer demand at a pace that justifies the investment.
Microsoft: Azure cloud revenue growing strongly, with AI contributing meaningfully to growth. The company confirmed that demand for Azure AI services is exceeding capacity — supply constrained, not demand constrained, with waitlists of 6-9 months in some regions for specific AI compute products. Full-year capex tracking above $80 billion. The AI run rate climbed past $37 billion annualized.
Amazon: AWS revenue of $37.59 billion, growing 28% year-over-year — the fastest pace in 15 quarters. CEO Andy Jassy committed approximately $200 billion in 2026 capital expenditure — the single largest annual capex commitment in Amazon’s history by a wide margin. Here is the number that stops you cold: free cash flow for the trailing twelve months compressed to $1.2 billion. That is a 95% decline year-over-year as AI infrastructure spending accelerated. Amazon is spending its cash flow almost entirely on AI infrastructure, betting that the revenue it generates will eventually replace and exceed it.
Meta: Revenue of $56.31 billion, up 33% year-over-year — the fastest growth since 2021. But Meta raised its full-year 2026 capex guidance to $125-145 billion, up from the prior $115-135 billion range. The stock fell 8% after hours. Simultaneously with reporting record revenue growth and raising the capex guide, Meta announced it is laying off approximately 8,000 employees — 10% of its workforce. The company is spending more on infrastructure while cutting the humans who work there.
Apple: Full-year capex guidance of approximately $65 billion — the smallest of the five but still historically large for Apple, which has traditionally been the most capital-light of the major tech companies.
The Paradox at the Center of the $650 Billion Story
Here is the paradox that no earnings call commentary fully resolves.
The companies spending the most aggressively on AI infrastructure — the ones committing hundreds of billions in capital — are doing so on the basis of a forecast. A specific, important forecast: that AI will generate enough revenue, at sufficient margin, to justify the infrastructure being built today.
The evidence for that forecast is genuine but incomplete.
Alphabet’s Google Cloud growing 63% is evidence. Microsoft Azure’s supply constraints are evidence. AWS growing 28% — its fastest pace in 15 quarters — is evidence. These are real revenue numbers, growing at real rates, from real enterprise customers paying real money for AI compute.
But the evidence is not complete, because the infrastructure being built today will not be fully operational for 12 to 36 months. The data centers being permitted today in Texas and Virginia and Malaysia will come online in 2027 and 2028. The $200 billion Amazon is spending in 2026 is buying capacity that won’t generate revenue until 2028.
Amazon’s free cash flow falling 95% is not a warning sign in isolation. It is what responsible infrastructure investment looks like when the timeline between spending and earning is measured in years, not months. Amazon spent aggressively on AWS infrastructure in 2013 and 2014 before AWS became the most profitable business in the company’s history.
The question — the one that no CEO answered directly on April 29 — is whether the AI revenue ramp will follow the same curve as AWS. Whether the demand that is currently overwhelming supply will sustain itself as supply scales to meet it. Whether enterprise AI customers will keep spending at current growth rates for the next three years while the infrastructure comes online.
The $650 billion bet is a prediction about enterprise AI adoption rates in 2027 and 2028.
Nobody knows if that prediction is right.
The Memory Price Shock Nobody Is Talking About
Buried in Meta’s earnings commentary is a detail that reveals something important about the specific pressures driving the capex escalation.
Meta’s CFO explained that the capex raise — from $115-135 billion to $125-145 billion — reflects “higher component pricing this year and, to a lesser extent, additional data center costs.” The specific component cited: memory pricing. High-bandwidth memory, or HBM, is the specialized memory architecture that enables the parallel processing required for large-scale AI model training and inference.
HBM is sold out through 2026. Every unit that Samsung, SK Hynix, and Micron can produce is committed to existing orders. Prices have risen sharply as demand has outpaced supply. And the companies building AI infrastructure have no choice but to pay the prevailing price, because HBM is not substitutable — you cannot train a large language model at competitive speeds without it.
What this means is that the $650 billion capex number is not just a reflection of AI demand. It is partly a reflection of a supply chain bottleneck in a specialized semiconductor component that has created a seller’s market at exactly the moment when buyer demand is at its peak.
The memory pricing surge inflates the nominal capex number. It does not necessarily inflate the capacity being purchased. A hyperscaler spending 10% more on HBM than it expected is buying roughly the same number of chips at higher cost — which means the $650 billion figure, in terms of actual AI capacity being added, may be somewhat less impressive than the headline suggests.
This matters for the payoff calculation. If the input cost of AI infrastructure is rising faster than expected while the output revenue is growing as expected, the return on investment compresses. Not catastrophically — the growth rates are still strong enough to absorb significant input inflation. But the margin on each dollar of AI infrastructure is thinner than it was twelve months ago.
The Compute Constraint Signal
The most important technical detail from the April 29 earnings calls was not discussed in most mainstream coverage. It is this: multiple hyperscalers — Alphabet, Microsoft, and Amazon specifically — described their AI businesses as supply-constrained, not demand-constrained.
Supply constrained means: we have more customer demand than we have capacity to serve. Customers want to buy more AI compute than we can currently sell them. Our revenue would be higher if we had more infrastructure online.
This is, in theory, the best possible condition for a capital-intensive business. It means that every dollar of new infrastructure that comes online converts immediately to revenue, because the demand is waiting to absorb it.
Alphabet’s CEO said directly: “We are compute constrained in the near term.” Microsoft confirmed that Azure AI demand is exceeding supply, with waitlists of 6-9 months for some products. Amazon’s Jassy described AWS as capacity-constrained in specific regions.
If this supply constraint is genuine — if it reflects real enterprise customer demand that is waiting to be served — then the $650 billion capex program is not a speculative bet on future demand. It is a response to existing, documented, unfulfilled demand. The revenue is already contracted. The infrastructure just needs to be built.
The critical question is whether the supply constraint reflects durable enterprise demand — companies integrating AI into their core operations in ways that generate ongoing, recurring revenue — or whether it reflects a wave of enterprise experimentation that will moderate as companies assess whether their AI investments are actually generating returns.
Enterprise AI adoption in 2025-2026 has been characterized by two distinct customer types. The first is production deployment — companies that have integrated AI into core workflows and are generating measurable productivity gains that justify ongoing and increasing spending. The second is evaluation and experimentation — companies that are spending on AI to understand its capabilities, but have not yet committed to production scale.
The hyperscalers’ revenue growth is real regardless of which type is driving it. But the durability of that growth — the sustaining of the demand that is currently creating supply constraints — depends heavily on whether the experimental customers convert to production customers at high rates over the next 24 months.
That conversion rate is the single most important variable for validating the $650 billion bet.
The Meta Paradox: Laying Off Humans to Fund AI
The most revealing data point from the entire earnings week is not a financial number. It is a simultaneous decision.
In the same week that Meta announced it was raising its AI capex guidance to $125-145 billion, the company announced it is laying off approximately 8,000 employees — 10% of its global workforce. It also canceled 6,000 open job requisitions.
This is the AI labor transition made visible in a single corporate action. Meta is replacing human capital with AI infrastructure, at a pace and scale that is measurable in real time.
The economics are explicit. An employee at Meta at the median compensation level costs approximately $250,000-$400,000 per year in total compensation including benefits. 8,000 employees represents $2-3.2 billion in annual labor cost savings. That savings — recurring, annually — is being redirected toward $145 billion in AI infrastructure that Meta believes will generate more value than the humans it is replacing.
Mark Zuckerberg’s stated vision — “personal superintelligence to billions of people” — is not an abstract aspiration. It is a specific capital allocation decision: less human intelligence, more artificial intelligence, at the largest scale any company has ever attempted.
The White Collar Bloodbath post in this series covered the broad trend. Meta’s Q1 earnings call was the most explicit single-company illustration of that trend we have seen. The largest social media company in the world, generating record revenue, growing at its fastest pace since 2021, laying off 10% of its employees and redirecting the savings into AI infrastructure.
Not because the company is struggling. Because the company is succeeding — and believes AI will let it succeed more, at lower human cost.
The Amazon Bet That Deserves Its Own Analysis
Amazon’s capex commitment of approximately $200 billion for 2026 is the single most consequential capital allocation decision in corporate America this year.
For context: Amazon’s total 2025 revenue was approximately $638 billion. Its 2026 capex commitment represents roughly 31% of its prior year revenue. No company of Amazon’s scale has ever committed capital at this ratio to a single technology investment cycle.
The free cash flow story tells the tale. Amazon’s free cash flow for the trailing twelve months fell to $1.2 billion — a 95% decline year-over-year. Amazon is generating revenue at extraordinary scale and deploying almost all of it back into infrastructure.
This is not a red flag if you believe in the AWS AI thesis. Amazon built AWS into the most profitable cloud business in the world by spending aggressively during its early years, accepting compressed cash flow in exchange for dominant market position. The $200 billion 2026 capex is, from Amazon’s perspective, the same bet — build the dominant AI infrastructure platform before competitors do, accept the cash flow impact now, generate the compounding returns over the next decade.
But it is a red flag for anyone who believes the AI revenue ramp will be slower or smaller than expected. If enterprise AI adoption plateaus in 2027 — if the experimental customers don’t convert, if the productivity gains are real but smaller than forecast — the $200 billion commitment produces infrastructure that exceeds demand. Utilization rates fall. Revenue per dollar of infrastructure falls. The cash flow that was sacrificed does not come back.
AWS CEO Matt Garman said it explicitly: Amazon is building infrastructure capacity now because “the demand signals are there.” He pointed to AWS revenue growing 28% year-over-year at a $150 billion run rate — the fastest growth in 15 quarters — as evidence that the demand signals are reliable.
He may be right. The 28% growth rate at $150 billion annualized is a number that, if sustained, validates the $200 billion capex decision decisively.
The question is whether it will be sustained.
What the $650 Billion Means for Ordinary Investors
The Big Tech earnings story is not just about the largest technology companies in the world. It is about the investment portfolios of roughly 60 million American households that hold these stocks — directly, through index funds, or through retirement accounts.
The five companies committing $650 billion in AI capex collectively represent approximately 25-30% of the S&P 500’s total market capitalization. A significant decline in any of them — or a repricing of AI growth expectations across the group — would produce the largest single-factor market correction since the dot-com bust.
The earnings calls of April 29-30 produced a mixed signal for investors. The revenue results were genuinely strong across the group. The capex commitments were larger than expected and will continue to suppress free cash flow and earnings growth in the near term. The supply constraint signals suggest that demand is real. The 95% free cash flow collapse at Amazon and the 8% post-earnings decline at Meta suggest that investor patience is not unlimited.
There are three scenarios that institutional investors are currently modeling.
Scenario One — The Thesis Holds: Enterprise AI adoption accelerates. The experimental customers convert to production customers at high rates. AI revenue grows fast enough to absorb the infrastructure investment. By 2028, the $650 billion year produces a generation of cloud AI businesses that dwarf AWS in scale and profitability. This is the bull case — and the current stock prices of the hyperscalers imply something close to it.
Scenario Two — The Slow Burn: Enterprise AI adoption is real but slower than the capex commitments assume. Revenue grows, but not fast enough to absorb $650 billion in annual infrastructure spending without significant compression of return on invested capital. The hyperscalers remain profitable but the AI investment cycle produces lower-than-expected returns. Stock prices correct to reflect lower growth multiples. This is the base case for the most cautious institutional investors.
Scenario Three — The Reckoning: AI revenue plateaus. Enterprise adoption proves shallower than supply constraints suggest — the experimental wave crests and retreats before converting to production scale. Infrastructure utilization rates fall. Free cash flow remains suppressed without the compensating revenue acceleration. The Bank of England’s warning about AI valuations and their interconnection with the broader financial system becomes relevant. This is the tail risk scenario — low probability but high consequence.
The distinction between Scenario One and Scenario Three is not visible in today’s data. It will become visible in 2027, when the infrastructure being committed in 2026 comes fully online. The investors who are right about which scenario materializes will be richly rewarded or severely punished — and they will know which one they were before anyone can tell them.
The Number That Tells You Where This Is Heading
There is one number from the April 29 earnings calls that tells you more about the AI investment cycle’s trajectory than any other.
Google Cloud’s order backlog nearly doubled quarter-over-quarter to over $460 billion.
$460 billion in committed, contracted future revenue from enterprise customers who have already signed agreements to purchase Google Cloud services. This is not speculative demand. This is contracted demand, with legal commitments, from enterprises that have made budget decisions and signed purchase agreements.
The $460 billion backlog — growing at the fastest rate ever recorded for Google Cloud — is the most direct evidence available that the demand driving the $650 billion capex commitment is real, documented, and legally obligated.
It does not guarantee the full $650 billion pays off. Contracts can be renegotiated. Enterprises can reduce their AI spending in a recession. The backlog represents committed spend, not guaranteed revenue recognition.
But $460 billion in contracted enterprise AI demand, growing faster than ever, is not the data profile of a bubble about to burst. It is the data profile of a technology cycle that is converting from hype to enterprise adoption at a scale that is genuinely historically unprecedented.
The $650 billion bet may be the right bet. The evidence from April 29 suggests it is not obviously wrong.
What it is, unambiguously, is the largest concentrated technology investment in human history. And the next 24 months will determine whether the people who made it were geniuses or the architects of the most expensive speculative cycle since the dot-com era.
Want to actually take action instead of just reading?
Most people understand what they should do with money — the problem is execution. That’s why I created The $1,000 Money Recovery Checklist.
It’s a simple, step-by-step checklist that shows you:
and how to start building your first $1,000 emergency fund without overwhelm.
where your money is leaking,
what to cut or renegotiate first,
how to protect your savings,
and how to start building your first $1,000 emergency fund without overwhelm.
No theory. No motivation talk. Just clear actions you can apply today.
If you want a practical next step after this article, click the button below and get instant access.
This is not financial advice. Always consult a qualified financial advisor before making significant investment decisions. If this helped you understand what the Big Tech earnings actually mean beyond the headlines — share it with someone who holds an index fund and wonders whether the AI boom is real. The answer is more complicated than either the bulls or the bears will tell you. And subscribe below for the next one.
Last Thursday, the U.S. Department of Labor released a number that should have made headlines everywhere.
Weekly jobless claims — the number of Americans filing for unemployment benefits for the first time — fell to 189,000. That is the lowest level in more than 50 years. More than five decades. Lower than during the dot-com boom of the late 1990s. Lower than the pre-COVID economy of 2019, which at the time was called the strongest job market in American history.
By one of the most watched measures of labor market health, the American economy is doing something it has not done since the early 1970s.
And simultaneously — in the same week this number was released — consumer confidence sits at a 75-year low. Inflation is running at 4.5% annualized. Americans are collectively carrying a record $1.277 trillion in credit card debt. Core PCE just printed at 4.3%, the highest since 2022. Gas costs over $4 a gallon nationally.
The same week the job market hit a 50-year high. The same economy. The same country. The same people.
How is it possible for the labor market to be the strongest it has been since before the moon landing — and for Americans to feel financially worse than at almost any point in modern history?
The answer is one of the most important things you can understand about personal finance in 2026. And almost nobody is explaining it clearly.
The Number That Should Have Been Everywhere
Let’s start with what actually happened.
Initial claims for unemployment insurance dropped by 26,000 to 189,000 in the week ending April 25, from 215,000 in the week ending April 18.
To put 189,000 in context: during the peak of the economic expansion in 2019 — when economists were using phrases like “historic labor market” and “full employment” — weekly initial claims were running in the range of 200,000 to 220,000. The COVID-era high was 6.8 million in a single week in April 2020. Normal pre-pandemic levels were 200,000-250,000.
189,000 is extraordinary. It means that in a week when oil is at $106, inflation is at 4.5%, consumer confidence is at a 75-year low, the Bank of England is warning about simultaneous financial crises, and prediction markets are pricing only a 10% chance of Middle East peace — Americans are not losing their jobs.
They are keeping them. At an extraordinary rate.
The unemployment rate from the March payroll survey was 4.3% — up slightly from the post-pandemic lows, but historically low. The April payrolls report drops next Friday, May 8. The March report added 178,000 jobs. The four-week moving average for jobless claims is 207,500 — still historically low.
By every conventional measure of the labor market, this is not an economy in recession. This is not an economy shedding jobs. This is an economy where workers, once employed, are not being fired.
So why does it feel like a financial catastrophe?
The Five Reasons You Feel Broke Despite Having a Job
The disconnect between labor market strength and financial distress is not psychological. It is structural. Five specific mechanisms are operating simultaneously to create the experience of financial hardship in an economy with a 50-year-low unemployment rate.
Reason 1: Your Wages Are Losing the Race to Inflation
Having a job and having economic security are not the same thing. The distinction depends entirely on one variable: whether your wages are growing faster than prices.
In 2026, they are not.
PCE inflation is running at 4.5% annualized. The median wage growth in the United States is running at approximately 3.5-4% annually. The gap — roughly 0.5 to 1 percentage point — means that the average American worker with a job is getting slightly poorer every month in real terms.
This is called negative real wage growth. It is the condition under which a fully employed person’s purchasing power declines despite receiving a paycheck. It is the specific mechanism that allows the job market to be at a 50-year high while consumers feel financially stressed.
You have a job. You got a raise. You are poorer than you were last year.
That is not a paradox. That is arithmetic. And it is the arithmetic that defines financial life for the majority of American workers right now.
Reason 2: The Bills You Cannot Escape
The inflation that matters most is not the broad PCE number. It is the inflation in the specific categories of spending that are not discretionary — the bills you cannot reduce regardless of how carefully you budget.
These categories have been inflating at rates well above headline CPI for years. Rent has risen 20-30% in most major metropolitan areas since 2020. Health insurance premiums have risen significantly faster than wages for over a decade. Childcare costs have increased to the point where, for families with young children, one parent’s entire income can be consumed by childcare costs alone.
These are not luxuries. They are the fixed costs of existence. And they have risen so much faster than wages over the past several years that the nominal wage increase most workers received between 2020 and 2026 was largely consumed by these mandatory expenditures before it reached discretionary spending.
The worker who had a job in 2020 and has a job in 2026 — who has never been unemployed — may genuinely have less discretionary income in real terms than they did six years ago, despite a higher nominal wage. The 50-year low in jobless claims does not change that arithmetic.
Reason 3: The Credit Card Trap
Americans are collectively carrying $1.277 trillion in credit card debt — the highest level in recorded history.
At an average interest rate of 22-24%, the annual interest charge on that balance is approximately $280-300 billion per year. That is $280-300 billion transferred annually from American households to credit card issuers — before a single dollar of principal is paid.
The median American with credit card debt is not carrying a small, manageable balance. The Federal Reserve Bank of New York’s data shows that approximately 22% of cardholders are carrying balances near their credit limit — the “revolving” segment that is paying interest every month and making minimal progress on principal.
For those households, having a job is necessary but not sufficient. The job generates income. The credit card interest consumes a significant portion of that income before it can be saved, invested, or spent on anything that improves quality of life. The 22-24% interest rate is not declining in a world where the Fed cannot cut rates. Every month the Fed holds — which, given core PCE at 4.3%, could be many more months — is another month of 22% interest compounding.
The 50-year labor market strength shows up in your paycheck. The credit card trap takes a portion of it before you see it.
Reason 4: The Cost of the War You Are Paying Without Knowing It
The Iran war has added a specific, measurable cost to every American household’s budget that does not show up as a line item on any bill.
National average gas prices above $4.00 per gallon represent approximately $600-900 in additional annual spending for the median American household compared to pre-war prices — assuming no reduction in driving behavior. The household that commutes 15,000 miles per year in a vehicle getting 28 miles per gallon uses approximately 535 gallons annually. At $1.50 more per gallon than pre-war prices, that is $800 more per year in gasoline costs alone.
Food prices have also risen as the Strait of Hormuz crisis disrupts fertilizer supply chains, increases shipping costs, and raises the energy costs embedded in food production and distribution. The Bureau of Labor Statistics tracks food at home inflation separately, and it has been running meaningfully above the Fed’s 2% target throughout the Iran war period.
The worker whose job has never been more secure is spending $800 more per year on gasoline, $400-600 more on groceries, and seeing pharmaceutical costs begin to rise from the drug tariffs announced in April — without any compensating increase in wages.
The war is a hidden tax. It does not appear on any ballot or any bill. It shows up in the gap between what your paycheck says and what your bank account has at the end of the month.
Reason 5: The Wealth Gap You Cannot Close
The final reason the 50-year job market low does not feel like prosperity is the most structural — and the hardest to address through any individual action.
The American economy has a K-shape. At the top of the K, asset owners — homeowners, stock investors, business owners — have seen extraordinary wealth appreciation since 2020. The homeowner who bought in 2019 has seen their home value increase 40-50%. The stock investor who held through COVID and the subsequent bull market has seen their portfolio dramatically appreciate.
At the bottom of the K, wage earners without significant asset holdings have seen their labor income grow at rates insufficient to close the gap with inflation. They have not benefited from asset appreciation because they do not own assets.
The 50-year labor market strength is largely a story about the bottom of the K. Jobs are plentiful. Layoffs are rare. The worker is employed.
But employment without asset ownership produces a different economic experience than employment with it. The homeowner with a paid-down mortgage whose home has doubled in value experiences the same inflation, the same gas prices, the same credit card environment — but from a position of accumulated wealth that absorbs those pressures. The renter whose wages are growing at 3.5% annually while rent grows at 5% and everything else grows at 4.5% is running in place on an escalator going down.
Having a job at a 50-year high does not close that gap. It just means the person at the bottom of the K keeps their spot on the escalator rather than falling off entirely.
The Specific Worker Who Is Most Exposed
The aggregate numbers obscure the specific populations for whom the disconnect between job market strength and financial distress is most acute.
Government workers. Federal employment continued to decline in March, per the BLS report. The DOGE-driven reductions in force at federal agencies — combined with hiring freezes and contract cancellations that affect federal contractor employment — are removing jobs from the segment of the workforce that typically offers the highest job security. The irony is that the job category associated most strongly with security is the one actively being downsized in 2026.
Young workers in high-cost markets. The worker who graduated in 2022-2024, entered the labor market at historically elevated entry-level wages, is employed in a knowledge economy job, and is renting in a major metropolitan area faces the full weight of all five mechanisms simultaneously. Wages that look good in absolute terms are insufficient relative to rent that has risen 25% since they started working. Credit card debt accumulated during the transition to independence. Gas costs they did not budget for when they took the job. No assets generating wealth alongside their labor income.
Part-time and gig economy workers. The jobless claims number measures people filing for unemployment insurance. Gig economy workers — independent contractors, rideshare drivers, freelancers, delivery workers — are not eligible for unemployment insurance in most states. The 189,000 figure does not count them if they lose income. The “job market strength” narrative is most accurate for traditional W-2 employees and least accurate for the expanding segment of the workforce in non-traditional arrangements.
Workers in interest-rate sensitive sectors. Real estate professionals, mortgage originators, home builders, furniture and appliance retailers — sectors whose employment is directly tied to housing market activity — are in a different job market than the aggregate 189,000 figure suggests. With mortgage rates at 6.75-7% and housing starts declining, these sectors are under real employment pressure even as the aggregate numbers hold up.
What the April 8 Jobs Report Will and Won’t Tell You
The Employment Situation for April is scheduled to be released on Friday, May 8, 2026. It will generate headlines. It will be analyzed by every major financial institution. It will move markets.
Here is what to look for beyond the headline number.
The payroll headline — expected to show continued solid job creation in the 150,000-200,000 range — will be the number that anchors the narrative. But the number that matters more for understanding the actual financial condition of American households is the real wage growth figure: average hourly earnings growth minus inflation.
If April average hourly earnings grew at 3.8% year-over-year and PCE inflation is running at 4.5%, real wages fell 0.7%. The headline jobs number will say strength. The real wage calculation will say deterioration. Both will be true simultaneously.
The unemployment rate — expected to hold near 4.3-4.4% — will confirm that the labor market is not collapsing. But the U-6 measure — which includes marginally attached workers and those working part-time involuntarily — tells a more complete story of labor market slack. Watch the gap between U-3 (the headline rate) and U-6 (the broader measure). A widening gap signals that the strong headline number is masking deteriorating quality of employment.
The federal government employment line — which has been declining as DOGE-related cuts flow through — will continue to be a drag on the headline. Analysts will strip it out to identify “private sector” job creation. That stripping-out is analytically valid but obscures the real human cost of government sector contraction in specific states and cities.
The Paradox Resolved
Here is the answer to the question in this post’s headline.
The job market’s 50-year strength and the consumer’s 75-year-low confidence are not contradictory. They are two measurements of different things.
Jobless claims measure one specific condition: whether employed people are losing their jobs. At 189,000, they are not. The labor market is genuinely strong by this measure.
Consumer confidence measures something broader and more personal: whether people feel financially secure, whether they believe their economic situation is improving or deteriorating, whether they feel optimistic about their financial future.
That measure can be at a 75-year low while jobless claims are at a 50-year low because the things that determine financial security are not only whether you have a job. They are whether your wages are keeping pace with inflation. Whether your fixed costs — rent, insurance, healthcare — are consuming an increasing share of your income. Whether your debt burden is sustainable at current interest rates. Whether you own assets that are appreciating alongside your labor income. Whether the hidden taxes of a war economy are eroding your purchasing power month by month.
On all of those measures, the answer for most American workers in May 2026 is not reassuring.
You have a job. That is genuinely good news in a world where 189,000 people filed for unemployment last week — the lowest number in 50 years.
But having a job, in 2026, is not the same as having financial security. And the gap between those two things — the gap that shows up simultaneously in the strongest job market in half a century and the weakest consumer confidence in three-quarters of a century — is the most important story in American personal finance right now.
Understanding that gap is not pessimism. It is clarity.
And clarity, in an uncertain economic environment, is the beginning of the right decisions.
This is not financial advice. Always consult a qualified financial advisor before making significant financial decisions. If this helped you understand why the economic headlines feel disconnected from your actual financial life — share it with someone who has a job and wonders why it doesn’t feel like enough. Most of America is wondering the same thing. And subscribe below for the next one.
Want to actually take action instead of just reading?
Most people understand what they should do with money — the problem is execution. That’s why I created The $1,000 Money Recovery Checklist.
It’s a simple, step-by-step checklist that shows you:
and how to start building your first $1,000 emergency fund without overwhelm.
where your money is leaking,
what to cut or renegotiate first,
how to protect your savings,
and how to start building your first $1,000 emergency fund without overwhelm.
No theory. No motivation talk. Just clear actions you can apply today.
If you want a practical next step after this article, click the button below and get instant access.
Yesterday morning, the Bureau of Economic Analysis released the number everyone had been dreading.
The first official measurement of the American economy during wartime. The first GDP print since oil closed the Strait of Hormuz. The data that would either confirm or deny the recession fears that have been building for two months.
The headline read: 2.0% growth.
Markets breathed. Anchors smiled. The word “resilient” appeared in approximately 400 separate financial news headlines within the first hour.
And almost nobody explained what is actually inside that 2.0% number. Almost nobody explained that the headline is constructed almost entirely from factors that will not repeat in Q2. Almost nobody explained that buried inside the same GDP report — released simultaneously with the headline — is an inflation number that should change how every American thinks about their financial life for the rest of 2026.
Here is what actually happened. Here is what the 2.0% is made of. And here is the number that matters more than the headline.
The 2.0% That Isn’t What It Looks Like
Real GDP increased at an annual rate of 2.0 percent in the first quarter of 2026, according to the advance estimate released by the U.S. Bureau of Economic Analysis. In the fourth quarter of 2025, real GDP increased 0.5 percent.
From 0.5% to 2.0% sounds like an acceleration. A recovery. Evidence that the Iran war has not derailed the economy.
But the headline rebound was driven largely by mechanical factors rather than fresh private-sector strength. Federal nondefense compensation snapped back as the late-2025 government shutdown reversed, and Iran-related defense spending added another layer to the growth print.
Strip those two distortions out and the picture changes dramatically.
Distortion one: The government shutdown bounce.
Federal nondefense employee compensation collapsed during the Q4 2025 shutdown and rebounded in Q1 2026 as workers returned and back pay flowed through the income accounts. That swing alone contributed a meaningful share of the 1.5 percentage-point pickup from Q4 to Q1.
This is not new economic activity. This is the government paying workers who weren’t paid last quarter. It shows up as Q1 growth. It will not repeat in Q2. The quarter that looks like a recovery is partly a mathematical artifact of a government shutdown that ended.
Distortion two: Iran war defense spending.
The Iran war has driven an extraordinary surge in government defense spending — new munitions contracts, accelerated procurement, force deployments, intelligence operations. That spending is counted as GDP. It is real economic activity. But it is activity driven by a war, not by organic economic growth. It is activity that consumes resources — capital, manufacturing capacity, skilled workers — that would otherwise be deployed in the private economy.
Government spending was led by federal employee compensation increasing after the end of the government shutdown that occurred in the fourth quarter, when it collapsed. The same government line that was crushed by the shutdown bounced by war spending.
What the “real” economy did in Q1:
The bigger question for the next two quarters is whether private consumption can pick up the baton as the shutdown-rebound and defense-spending tailwinds fade. Without that handoff, the 2.0% headline risks looking like the high water mark rather than the start of a new acceleration phase.
Consumer spending showed signs of fatigue. Investment in residential structures declined. Even as the AI buildout boosted equipment spending, housing continued to weaken.
Spending on imports grew significantly more than did spending on exports, resulting in net exports reducing real GDP growth by 1.3 percentage points.
The trade deficit subtracted 1.3 percentage points from growth. Housing construction fell. Consumer spending decelerated from recent quarters.
The 2.0% headline is a number assembled from a government shutdown reversal and war spending, masking a private sector that is slowing down in the face of $4+ gasoline, record credit card debt, and the highest inflation in years.
Q1 2026 GDP printing at 2.0% looks reassuring on the surface but reads as a fragile rebound once the federal compensation snapback and Iran-related defense outlays are isolated.
The Number Nobody Is Leading With
Here is the number that was released simultaneously with the 2.0% GDP headline — and that received a fraction of the media attention.
The personal consumption expenditures (PCE) price index increased 4.5 percent, compared with an increase of 2.9 percent. The PCE price index excluding food and energy increased 4.3 percent, compared with an increase of 2.7 percent.
Read those numbers again.
The PCE price index — the Federal Reserve’s preferred measure of inflation, the one it has been fighting for three years, the one it has a 2% target for — just printed at 4.5%.
Core PCE, which strips out volatile food and energy prices to reveal underlying inflation — just printed at 4.3%.
For context:
The Fed’s inflation target is 2.0%
Core PCE in Q4 2025 was 2.7%
Core PCE in Q1 2026 is 4.3%
In a single quarter, the Fed’s preferred inflation gauge moved from 2.7% to 4.3%. A 1.6 percentage point surge. The largest quarterly acceleration in core PCE since the initial post-COVID inflation burst of 2021.
When the BEA says the PCE price index rose at a 4.5% annualized rate, it means that if prices kept rising at their Q1 pace for a full year, the average American would see their purchasing power fall by roughly 4.5% from inflation alone. The Federal Reserve has spent two years trying to bring inflation down to 2%, and this quarter it moved sharply in the wrong direction.
Why 4.3% Core PCE Is the Most Important Number of 2026
The distinction between headline PCE and core PCE matters enormously for monetary policy — and therefore for your mortgage rate, your credit card rate, and the cost of everything you buy.
Headline PCE includes food and energy. It is more volatile. It can spike when oil spikes and fall when oil falls. The Fed is supposed to “look through” headline moves driven by energy, because they are often temporary.
Core PCE — the number that just hit 4.3% — is different. It strips out food and energy to reveal the underlying inflation pressure in the economy: services, rent, wages, healthcare, insurance, education. These categories change slowly. When they accelerate, they tend to stay accelerated for months or quarters.
Core PCE at 4.3% is not an oil price story. It is a wage story. A rent story. A services story. It is the inflation that was supposedly under control — the inflation that the Fed’s rate hiking cycle was supposed to have contained — surging back toward levels not seen since 2022.
The implications for monetary policy are severe and immediate.
The IMF cautioned that with the policy rate close to neutral, there is little room to cut interest rates in 2026, particularly given the rise in energy prices, the likely passthrough to core inflation, and the upside risks to global commodity prices that are likely to further delay the return to the inflation target.
The IMF was warning about this scenario before the Q1 data was released. The Q1 data confirmed it — and then some. Core PCE at 4.3% doesn’t just make rate cuts impossible. It raises the question of whether the Fed needs to consider rate increases at a moment when the economy, stripped of its one-time factors, is slowing.
That combination — slowing private sector growth and surging core inflation — is the definition of stagflation. And the Q1 GDP report is the most explicit stagflation data print the United States has produced since the 1970s.
The Stagflation Trap: Why There Is No Good Policy Response
Stagflation is the economic condition that central banks are least equipped to handle. Every tool the Fed has works in one direction or the other — it cannot simultaneously fight inflation and support growth.
Normal recession: Growth falls, inflation falls. Fed cuts rates. Works. Normal overheating: Growth surges, inflation rises. Fed raises rates. Works. Stagflation: Growth falls, inflation rises simultaneously. Fed has no clean answer.
The inherent ambiguity in the monetary-policy path out of stagflation was amplified by the disruption to the dataflow from the October government shutdown. In the second half of the year, the data will provide more clarity as to which side of the stagflation dilemma, and therefore, which side of the Fed’s dual mandate, requires more attention.
But the Q1 data has made the dilemma sharper, not clearer. Core PCE at 4.3% is unambiguously above target. Private sector growth, stripped of one-time factors, is decelerating. Even if diplomacy prevails, the negative shock to the economy is already set in motion. Spillovers are likely to extend into the second half of the year — even if a peace agreement is reached in the coming weeks.
This means the Fed faces two deeply uncomfortable options going into June’s meeting — the first meeting where Kevin Warsh will occupy the chair.
Option A: Hold rates and accept that core PCE at 4.3% will continue to erode household purchasing power month after month, that inflation expectations will continue drifting higher from their already elevated 4.8% level, and that the Fed’s credibility on its inflation mandate will weaken.
Option B: Raise rates into a slowing private economy where consumers are already stretched — record credit card debt, 75-year-low sentiment, decelerating spending — and risk tipping a fragile growth picture into an outright recession.
There is no Option C that makes both problems go away simultaneously. The Q1 GDP report eliminated the possibility that the situation would resolve itself quietly.
What the GDP Report Means for Your Wallet
The abstract becomes personal very quickly.
Your mortgage rate. The 30-year fixed mortgage rate is priced against the 10-year Treasury yield, which is priced against inflation expectations. Treasury yields ticked higher on the firmer price index immediately after the GDP release. Core PCE at 4.3% tells bond markets that inflation is not under control. Bond markets that see uncontrolled inflation demand higher yields as compensation. Higher yields mean higher mortgage rates. The 30-year fixed rate, already at 6.75-7%, has another reason to stay elevated or rise further.
Your purchasing power. If prices kept rising at their Q1 pace for a full year, the average American would see their purchasing power fall by roughly 4.5% from inflation alone. That is not a hypothetical. That is the annualized pace of what just happened in the first three months of 2026. If your wages are not rising at 4.5%+ annually, you are getting poorer in real terms. The median American wage growth is running well below that.
Your savings. High-yield savings accounts paying 4.5-5% annualized are, in a world of 4.5% PCE inflation, producing exactly zero real return. The money sitting in your high-yield savings account is keeping pace with inflation — no better, no worse. That is not a bad outcome, but it is not the real return that most people assume when they see 4.5% APY on their savings app.
Your credit card debt. Credit card rates at 22-24% are not coming down if the Fed cannot cut rates. The Q1 inflation data has pushed any Fed rate cuts further into the future. Every month of delay is another month of 22% interest compounding on the record $1.277 trillion in American credit card balances.
Your job security. AI, which has had minimal impact on labor demand so far, could begin to weigh on hiring. More subtly, optimism about AI could act as a drag on the labor market if it gives CEOs greater confidence — or cover — to reduce headcount. Add that to the war-driven uncertainty already causing companies to freeze hiring plans, and the labor market that has held up through the first quarter of 2026 faces meaningful downside risk in Q2 and Q3.
The Q2 Problem Nobody Is Modeling Yet
The Q1 number, whatever its construction, is done. It will be revised once on May 28 and again on June 25 — and the revisions could be meaningful either up or down, as they were for Q4 2025 (revised from 1.4% to 0.5% over two rounds of revisions).
But the Q2 picture is what should dominate strategic thinking right now. And the Q2 picture, from everything visible today, is significantly more challenging than Q1.
The shutdown bounce will not repeat. Federal employee compensation will not receive a second one-time bounce. That contribution to GDP disappears.
The defense spending surge may continue, but the first-quarter effect of accelerated procurement contracts flowing into GDP calculations will moderate as the pipeline catches up with demand.
Consumer spending decelerated in Q1. Gas prices above $4 nationally — and the pharmaceutical tariff costs beginning to flow through to household budgets — will continue to constrain discretionary spending in Q2.
The jump in energy prices will take some of the shine off what would otherwise have been a strong year for the economy. Some of the strength of consumer spending in March is payback for the poor weather at the start of the year. Fiscal stimulus is more than outweighing the drag from higher energy prices for now, but that balance will begin to shift in the months ahead, especially with gas prices still climbing.
The Q2 GDP print — which won’t be available until late July — will be the data point that determines whether 2026 is a year of resilient growth-with-inflation, or the first year of a stagflationary contraction that the Q1 number only hinted at.
The question “is this a recession?” cannot be answered until Q2 data arrives. But the ingredients for a negative Q2 are visible in today’s report.
The One Question This Data Demands
Jerome Powell spent his last Fed press conference yesterday choosing words with extraordinary precision. He held rates. He said “patient.” He preserved optionality. He did not say the word stagflation.
The Q1 GDP data, released this morning, is the first piece of official evidence for what Powell would not name.
Core PCE at 4.3% — more than twice the Fed’s target. GDP growth built on a government shutdown reversal and war spending. Consumer spending decelerating. Housing contracting. A trade deficit subtracting 1.3 percentage points from growth.
The word Powell will not say is the word that describes this data most accurately.
Kevin Warsh inherits this economy in the next few weeks. His first June press conference — with updated economic projections — will be the moment when the Fed either acknowledges the stagflation diagnosis explicitly or continues to manage around it with language designed to preserve optionality.
The data will not wait for the language to catch up.
Core PCE at 4.3% is not a forecast. It is not a scenario. It is a measurement of what happened between January and March 2026 in the American economy.
The 2.0% headline was the number that sounded reassuring.
4.3% core PCE is the number that tells you what is actually happening.
This is not financial advice. Always consult a qualified financial advisor before making significant financial decisions. If this helped you understand why the “good” GDP number yesterday deserved a closer look — share it with someone who took the headline at face value. The number that matters most was the one that didn’t trend. And subscribe below for the next one.
Want to actually take action instead of just reading?
Most people understand what they should do with money — the problem is execution. That’s why I created The $1,000 Money Recovery Checklist.
It’s a simple, step-by-step checklist that shows you:
and how to start building your first $1,000 emergency fund without overwhelm.
where your money is leaking,
what to cut or renegotiate first,
how to protect your savings,
and how to start building your first $1,000 emergency fund without overwhelm.
No theory. No motivation talk. Just clear actions you can apply today.
If you want a practical next step after this article, click the button below and get instant access.
Right now, as you read this, the most powerful unelected official in the world is sitting in a room at the Marriner S. Eccles Federal Reserve Building in Washington, D.C., preparing for what will almost certainly be the last major decision of his career.
Jerome Powell has been chair of the Federal Reserve since 2018. He navigated the COVID-19 collapse. He oversaw the fastest rate hiking cycle in 40 years. He watched inflation peak at 9.1% and managed it back toward target. He held the financial system together through a war that closed the world’s most important energy chokepoint and sent oil above $140.
On Wednesday, he speaks at a press conference for what is expected to be the final time as Fed Chair. Kevin Warsh has been nominated as his replacement. The transition is imminent.
And Powell is walking into this last press conference facing the most impossible monetary policy decision in a generation.
Here is what he has to decide. Here is what hangs on that decision. And here is what it means for your mortgage, your savings, your retirement, and the economic environment you will live in for the next two years.
The Impossible Choice Powell Faces Today
The Federal Reserve has one primary job: control inflation while supporting maximum employment. When those two goals align — when inflation is low and unemployment is low — the job is straightforward. When they conflict — when inflation is too high AND the economy is weakening simultaneously — the Fed faces a genuine dilemma. There is no policy tool that fights inflation and supports growth at the same time. The tools work in opposite directions.
That conflict, which economists call stagflation, is exactly what Powell faces today.
The inflation side of the dilemma:
Core PCE inflation — the Fed’s preferred measure — is now projected at 2.7% for 2026, up from December’s projection of 2.5%. Oil at $106 per barrel, with the Strait of Hormuz still effectively closed, is pushing energy inflation into every layer of the economy. April CPI data, which arrives in mid-May, will reflect the March surge and likely show continued upside pressure. The IMF’s Executive Board cautioned that with the policy rate close to neutral, there is little room to cut interest rates in 2026, particularly given the rise in energy prices, the likely passthrough to core inflation, and the upside risks to global commodity prices that are likely to further delay the return to the inflation target.
Translation: inflation is not under control. Cutting rates in this environment risks re-igniting the problem Powell spent three years fighting.
The growth side of the dilemma:
Q4 2025 GDP was revised down to just 0.5% on the third estimate, from 1.4% at the advance stage — a significant deterioration that only became clear in retrospect. With inflation moving higher throughout the first half of 2026, Deloitte expects the Fed to hold rates steady until December. Tomorrow, the Bureau of Economic Analysis releases the advance estimate of Q1 2026 GDP — the first official measurement of the wartime economy. Forecasts are not optimistic. The Atlanta Fed’s GDPNow model has been tracking negative Q1 growth.
Consumer confidence hit a 75-year low in April. The Walmart Recession Signal is at its highest point since 2008. Moody’s Analytics puts recession probability at 48.6%.
Translation: the economy may already be contracting. Holding rates at 3.5-3.75% in a recession risks turning a slowdown into something much more severe.
The options Powell has — and what each one costs:
Option A: Hold rates steady. The safe choice. The expected choice. Markets are priced for steady policy the next few months as policymakers wrestle with economic impacts from the war in Iran and spiking crude oil prices. Holding signals that the Fed is not panicking, that it believes the oil shock is temporary, and that it prioritizes inflation credibility. The cost: if Q1 GDP is negative and the economy is already in recession, holding rates while the economy contracts risks turning a mild slowdown into something significantly worse.
Option B: Cut rates. The growth-supportive choice. The choice that one Fed governor — Stephen Miran — already dissented in favor of at the March meeting. Only Stephen Miran dissented in favor of a 25-basis-point cut at the March meeting. Cutting would signal that the Fed sees the recession risk as more urgent than the inflation risk. The cost: oil at $106, inflation expectations at 4.8%, core PCE at 2.7% — cutting rates in this environment would almost certainly push inflation higher and potentially destroy the Fed’s credibility on its primary mandate.
Option C: Raise rates. The hawkish choice. The choice that Macquarie and JPMorgan have modeled as a scenario for 2026. 14 FOMC participants now see one or no cuts this year versus eleven in December 2025. Raising rates would send the most aggressive inflation-fighting signal possible. The cost: raising rates into a potential Q1 contraction would be the most aggressive economic tightening since Volcker’s 1981 shock — the one that deliberately induced a recession to break inflation. The political and human cost of that choice, in an economy where consumer confidence is already at a 75-year low, would be severe.
There is no good option. The war created a situation where every tool the Fed has either fights the wrong problem or makes the other problem worse.
Why This Press Conference Is Different From All the Others
Powell has held press conferences after every FOMC meeting since he became chair. Most of them were closely watched but ultimately followed a predictable script — rates held, rates cut, rates raised, with careful language designed to manage expectations without surprising markets.
Today is different for three reasons that compound each other.
Reason one: It is almost certainly his last. Kevin Warsh’s confirmation process is advancing. The uncertain geopolitical environment may inject more uncertainty into the ultimate path of the federal funds rate, and for now it appears that any potential Fed rate cuts are on hold until later this year or next. Powell is not positioning for a future he will oversee. He is setting the table for a successor whose policy instincts differ from his own in significant ways. The decisions Powell makes today will constrain Warsh’s options in ways that Powell, as a departing chair, may be less cautious about than he would be if staying.
Reason two: The GDP data lands tomorrow. The advance estimate of Q1 2026 GDP releases Thursday, April 30 — one day after today’s press conference. Powell will speak without knowing the official number, even though his models have access to more real-time data than any public forecast. If Q1 GDP comes in negative, the Fed’s communication today — hold steady, patient, data-dependent — will look immediately inadequate against a headline that says “US economy contracted in Q1.” The sequencing creates a communication risk that is nearly impossible to manage perfectly.
Reason three: The incoming chair has signaled a different approach. Warsh testified before Congress last week that Trump “didn’t ask for” lower rates — deliberately creating distance between the White House’s stated preference for rate cuts and his own positioning as an independent actor. But Warsh has historically been more hawkish than Powell on inflation, more skeptical of quantitative easing, and more concerned about the Fed’s credibility than its growth support function. The policy trajectory that Warsh inherits from today’s decision is the starting point for a Fed leadership transition at a moment of maximum economic stress.
What the Dot Plot Will Tell You That Powell Won’t Say Directly
The Federal Reserve communicates in a specific, carefully structured way. Jerome Powell’s words at the press conference will be chosen with extraordinary precision. Every sentence will be calibrated to avoid surprising markets, to preserve optionality, and to signal direction without committing to timing.
But there is a document released alongside today’s decision that is more revealing than anything Powell says: the Summary of Economic Projections — the “dot plot” — which shows where each anonymous FOMC member expects rates to be at year-end 2026, 2027, and 2028.
Wait — today’s April meeting does NOT include updated economic projections. The next projections meeting is June 17. That means today’s communication is limited to the rate decision itself, the accompanying statement, and Powell’s press conference answers. There is no dot plot update until June. No revised GDP forecasts. No revised inflation projections.
This is the most important thing most people covering the Fed today will not mention clearly enough.
Today is a pure communication event. The decision itself — almost certainly another hold — is not the news. The news is how Powell frames the future. Does he signal that cuts are still possible in 2026? Does he acknowledge the recession risk explicitly? Does he mention the GDP print releasing tomorrow? Does he signal concern about the Strait of Hormuz’s effect on inflation expectations?
The language Powell uses today will be parsed by every major institutional trading desk within seconds of the press conference ending. Algorithms will look for key words and phrases — “patient,” “data-dependent,” “both-sided risks,” “watching carefully” — and translate them into probability adjustments for future rate moves. Rates on everything from mortgages to corporate loans will shift based on Powell’s word choices.
That is the nature of the most powerful communication role in global finance. And today is the last time Powell occupies it.
The Legacy Powell Is Walking Away From
Jerome Powell has been the Fed chair for eight years. His record is genuinely extraordinary in some respects and genuinely complicated in others.
The complicated part is well-documented. Powell and the Fed held rates near zero through 2021 as inflation began building — famously calling that inflation “transitory” in language that became one of the most criticized central bank communications in recent history. When it became clear that inflation was not transitory, the Fed hiked rates faster than at any point since the 1980s — 525 basis points in 16 months — a shock to mortgage markets, bond markets, and any business that had borrowed on the assumption of continued cheap capital.
The extraordinary part is less discussed. After the fastest rate hiking cycle in four decades, the United States did not enter a recession. Employment stayed strong. The “soft landing” that most economists said was impossible was, by most conventional measures, achieved. Inflation fell from 9.1% in June 2022 to approximately 2.4% by early 2025. The financial system, stressed but not broken by the 2023 regional bank failures, survived without a systemic crisis.
Powell noted in his March press conference that oil shocks are something the Fed typically looks through — emphasizing the importance of making sure longer-term inflation expectations remain anchored. That framing — treat the oil shock as temporary, anchor long-term expectations, avoid overreacting — is the intellectual approach he will defend today as his final act.
Whether history vindicates that framing depends entirely on whether the Strait of Hormuz reopens on a timeline that allows inflation to fall without a recession materializing. If peace comes in Q2 and oil retreats to $75, Powell’s patient approach will look like wisdom. If the conflict extends through Q3 and Q4 with oil above $100, it will look like a dangerous delay in confronting a structural inflation problem.
That judgment will be made by someone else. Kevin Warsh will be the one navigating the outcome of whatever Powell decides today.
What Warsh Inherits — And Why It Matters to You
Kevin Warsh is not a household name outside of financial circles. He should be.
Warsh served on the Federal Reserve Board of Governors from 2006 to 2011 — including through the 2008 financial crisis. He was, at 35, the youngest person ever appointed to the Fed Board. He has been a senior fellow at the Hoover Institution at Stanford, a key advisor in Trump’s economic orbit, and a consistent voice for Fed independence even when that independence conflicts with White House preferences.
His monetary policy instincts are measurably more hawkish than Powell’s. He was skeptical of quantitative easing programs during his tenure. He has written extensively about the risks of central bank mission creep — the Fed taking on responsibilities beyond its core mandate. He has argued that the Fed’s credibility depends on its willingness to accept economic pain in service of price stability.
That last point is the one most directly relevant to the economic environment he is inheriting.
If Q1 GDP is negative tomorrow, and inflation is still running at 2.7% core PCE, and oil is at $106 with the Strait still closed, Warsh’s opening months as Fed Chair will define his entire tenure. The choice between cutting rates to support growth — and risking inflation re-acceleration — versus holding or raising rates to fight inflation — and risking a deeper recession — will be the first and most consequential decision of his career in the chair.
The economic conditions Powell hands Warsh today are the most difficult since Paul Volcker inherited the stagflation of the late 1970s. Volcker’s response — the most aggressive rate hike cycle in modern American history, deliberately inducing a recession to break inflation — is now studied as either a triumph of monetary policy courage or a catastrophe of unnecessary human suffering, depending on who is doing the studying.
Warsh does not need to be Volcker. But he may need to choose between paths that Volcker would recognize.
The Three Numbers That Define Your Financial Life in 2026
Today’s Fed decision, tomorrow’s GDP print, and next month’s CPI reading will together define three specific numbers that determine the financial environment for every American household in 2026 and 2027.
The mortgage rate. Every basis point movement in the 10-year Treasury yield — which responds to Fed policy and inflation expectations — translates directly into mortgage rate changes within 2-4 weeks. If Powell’s language today signals that cuts are further away than markets hoped, the 10-year yield rises, and mortgage rates rise with it. The 30-year fixed rate, currently around 6.75%, would approach 7% in a scenario where the Fed signals prolonged holding. For the family that was waiting for rates to come down before buying a home — that wait just got longer and potentially more expensive.
The credit card rate. Credit card rates follow the federal funds rate with a lag of approximately one billing cycle. At 3.5-3.75% federal funds rate, average credit card rates are running 21-24%. Every month that the Fed holds — every month that rate cuts are pushed further into the future — is another month of 22% interest compounding on the record $1.277 trillion in American credit card debt. The $450 billion in annual interest charges that American households are paying is not falling. If anything, it is about to get more expensive.
The recession probability. The Q1 GDP print tomorrow is the number that determines whether the United States economy is officially on the edge of a technical recession — defined as two consecutive quarters of negative growth. Q4 2025 came in at 0.5% on the third revision. If Q1 2026 is negative, we are one quarter away from a technical recession. General government debt is expected to exceed 140 percent of GDP by 2031, and Directors stressed the pressing need to address the US fiscal situation. The government’s ability to respond to a recession with fiscal stimulus — the playbook from 2008 and 2020 — is constrained by a deficit already running at 7-7.5% of GDP.
What Smart Money Is Doing Right Now
The institutional positioning ahead of today’s Fed decision is unusually clear in its consensus — and unusually diverse in its conviction.
The base case — which accounts for the majority of institutional positioning — is that Powell holds today, signals continued patience, uses language that preserves optionality for a late-2026 cut, and avoids explicitly addressing the GDP print that arrives tomorrow.
Within that base case, institutional investors are positioned as follows:
Short-term Treasuries over long-term. The uncertainty about the rate path makes long-duration bonds more risky than short-duration. A 3-month T-bill at 4.8% annualized is a better risk/reward than a 10-year note at 4.5% if there is any chance rates rise rather than fall.
Energy over technology. The Q1 sector data that showed Energy up 38% and Technology down 7.5% reflects a fundamental repricing that has not fully corrected. As long as oil is at $106 and the Strait is closed, the macro environment that produced Q1’s sector divergence persists.
Cash as optionality. Warren Buffett’s record cash hoard at Berkshire Hathaway is not unique — institutional investors are holding elevated cash balances precisely because the range of outcomes from today’s Fed decision, tomorrow’s GDP print, and next month’s CPI is wide enough to justify keeping powder dry. The investors who have cash when the GDP print drops and markets move will have the best entry points regardless of which direction the move goes.
Gold as insurance. At $3,300+ per ounce, gold is pricing a scenario where either recession forces rate cuts that weaken the dollar, or inflation persists in ways that erode purchasing power. Either scenario is positive for gold. The metal is the clearest hedge against the uncertainty that today’s Fed meeting and tomorrow’s GDP print represent.
The Bottom Line for April 28, 2026
Jerome Powell is making a decision today that will be studied in economics courses for decades.
The tools he has don’t fit the problem he faces. The problem is simultaneously too much inflation and too little growth — a combination that the rate-setting toolkit was not designed to resolve cleanly. Every path available involves accepting damage in one direction to prevent damage in the other.
The FOMC’s statement noted that “the implications of developments in the Middle East for the U.S. economy are uncertain.” That sentence — one of the most understated in Federal Reserve history — is the honest summary of the situation Powell inherits, navigates, and hands to his successor today.
Tomorrow, the GDP print arrives. Next month, the CPI data arrives. In June, Warsh takes the chair and makes his first decision. The path of interest rates, mortgages, recession probability, and the cost of everything you buy will be shaped by this week’s sequence of events more directly than by any other week in the past several years.
Pay attention to what Powell says today. Not just the headline decision — which will almost certainly be another hold — but the language. The framing. The specific words chosen by a man who has spent eight years learning exactly what each word costs.
That language is the map for the next twelve months.
This is not financial advice. Always consult a qualified financial advisor before making significant financial decisions. If this helped you understand why today’s Fed meeting matters more than any in recent memory — share it before the press conference starts. The decision that shapes your mortgage rate, your credit card rate, and your recession risk is being made right now. And subscribe below for the next one.
Want to actually take action instead of just reading?
Most people understand what they should do with money — the problem is execution. That’s why I created The $1,000 Money Recovery Checklist.
It’s a simple, step-by-step checklist that shows you:
and how to start building your first $1,000 emergency fund without overwhelm.
where your money is leaking,
what to cut or renegotiate first,
how to protect your savings,
and how to start building your first $1,000 emergency fund without overwhelm.
No theory. No motivation talk. Just clear actions you can apply today.
If you want a practical next step after this article, click the button below and get instant access.
That’s the story most people heard about the first quarter of 2026. The Iran war started on February 28. The Strait of Hormuz closed. Oil surged above $140. Consumer confidence hit a 75-year low. And yet the S&P 500 didn’t collapse. It wobbled. It whipsawed. It had days of terror and days of relief. But the index itself — the number everyone watches on the evening news — ended the quarter without a catastrophic breakdown.
So most people concluded: the market handled it.
They are looking at the wrong number.
Here is the number they should be looking at. In Q1 2026, the Energy sector of the S&P 500 returned positive 37.91%. In the same quarter, the Consumer Discretionary sector returned negative 8.55%. The Financials sector returned negative 9.40%. Technology returned negative 7.57%.
A 37.91% gap between the best and worst sectors — in a single quarter — is the largest sector performance divergence recorded since the 2008 financial crisis.
The market didn’t crash. It split. Violently. Into winners and losers that could not be more different. And the split maps almost perfectly onto a single variable: exposure to the price of oil.
If you held the wrong sectors going into February 28, the Iran war cost you 8-10% of your portfolio value in three months.
If you held the right sectors, you made 38%.
Most Americans hold the wrong sectors. Here is why — and what it means for the next quarter.
The Quarter in Full: What Each Sector Did and Why
Understanding the Q1 2026 sector performance map requires understanding the specific mechanism through which the Iran war affected each part of the economy. The numbers are not random. Every sector’s performance traces directly to its relationship with energy prices, supply chains, and the interest rate environment created by the conflict.
Energy: +37.91%
The arithmetic is simple. Oil went from approximately $70 per barrel at the start of 2026 to above $140 at the peak of the Strait crisis. Companies that produce, transport, refine, and sell oil and gas saw revenue surge proportionally. ExxonMobil, Chevron, ConocoPhillips, EOG Resources, Pioneer Natural Resources — every major US energy producer reported or guided to earnings that reflected the extraordinary windfall of $100+ oil.
The sector’s +37.91% in a single quarter puts it on pace — if sustained — for a return of roughly 150% annualized. That is not a typo. That is the math of a commodity that doubled in price when the businesses producing it had largely fixed production costs.
The irony is that energy was one of the most hated sectors among institutional investors entering 2026. ESG mandates had reduced energy exposure across pension funds and sovereign wealth funds. The AI boom had redirected capital toward technology. The prevailing view was that energy was a “value trap” in a world transitioning to clean power.
The Iran war made that view catastrophically expensive for the investors who held it.
Materials: +10.68%
The materials sector — mining companies, chemical producers, metals and minerals — benefited from two war-related dynamics simultaneously. First, oil price inflation inflated the cost of energy inputs across global manufacturing, raising the nominal value of material outputs. Second, the supply chain disruptions created by the Strait closure created shortages of specific materials — sulfur, certain industrial chemicals, specialty metals — that flow through Middle Eastern supply chains.
Gold mining companies saw particular strength as gold hit and then exceeded $3,300 per ounce — the safe-haven trade that runs parallel to every geopolitical escalation in the modern era.
Utilities: +8.26%
The utilities sector’s outperformance reveals something important about how the war reshaped the investment landscape. Utilities are traditionally considered a “defensive” sector — slow growth, high dividends, stable earnings regardless of economic conditions. They are the sector you own when you are afraid.
But in Q1 2026, utilities got a second tailwind beyond fear: the AI energy demand story. The same sector that provides power to data centers, that is building new transmission infrastructure, that is benefiting from the nuclear energy renaissance — utilities became simultaneously a fear trade and a structural growth trade. That combination produced the 8.26% return.
Consumer Staples: +6.12%
Similar logic to utilities. When consumers are afraid, they keep buying necessities. When institutional investors are repositioning toward defensive sectors, consumer staples benefit. Procter & Gamble, Costco, Walmart, Kroger — the companies selling things people buy regardless of how the war is going — absorbed capital rotating out of more exposed sectors.
The fact that Walmart is in this list while Consumer Discretionary is down 8.55% is the most direct visual representation of the K-shaped economy this post has described throughout this series. Walmart up. Luxury and discretionary retail crushed.
Industrials: +4.55%
A mixed picture within a positive return. Defense contractors — Lockheed Martin, Northrop Grumman, Raytheon, General Dynamics — had a spectacular quarter as defense spending expectations surged globally. Infrastructure companies benefited from the same government spending tailwind.
But non-defense industrials — manufacturing companies dependent on global supply chains, transportation companies facing fuel cost surges — were under significant pressure within the sector. The positive return masks a wide internal dispersion.
Real Estate: +1.87%
The smallest positive return of the positive sectors, and the one most at risk in Q2. Real estate investment trusts are fundamentally interest-rate-sensitive instruments — their value depends on the spread between property yields and borrowing costs. Higher interest rates compress that spread and reduce REIT valuations.
The positive return in Q1 reflects the beginning-of-year rate cut expectations that the war subsequently destroyed. REITs that rallied on the assumption of Fed cuts are now sitting in portfolios where those cuts are no longer priced. The 1.87% gain may reverse in Q2 as the “higher for longer” reality fully penetrates real estate valuations.
Communication Services: -5.53%
Alphabet, Meta, Netflix, Disney — the companies that dominate this sector face a specific war-related headwind: advertising revenue is cyclically sensitive to economic confidence, and economic confidence collapsed in Q1. When businesses are uncertain, advertising budgets are among the first expenses to be reduced. The 5.53% decline reflects both the advertising cycle and the general rotation away from growth-oriented assets.
Health Care: -4.90%
The pharmaceutical tariff announcement on April 2 — 100% tariffs on branded drug imports — arrived after the quarter ended, but health care stocks began pricing the regulatory risk as administration intentions became clear. Additionally, health care as a sector carries meaningful supply chain exposure to the same global trade disruptions that hurt other import-dependent sectors.
Technology: -7.57%
The sector that defined the bull market of 2023-2025 — AI chips, cloud computing, software platforms, consumer hardware — gave back significant gains in Q1 as the war created a specific headwind for the AI investment thesis: higher energy costs threaten the economics of the data center buildout that powers the entire sector.
IBM maintained full-year guidance after its earnings beat but the stock fell 8% because investors expected better. ServiceNow crashed 18% because the Middle East conflict explicitly hindered subscription revenue growth. The “Magnificent Seven” — whose earnings growth is projected at roughly 18% for full year 2026 — are seeing their influence on the overall market moderate as the rotation away from technology concentration continues.
Consumer Discretionary: -8.55%
Amazon, Tesla, Home Depot, Nike, McDonald’s — the sector representing everything Americans spend money on beyond necessities. This is the sector most exposed to the squeeze that $100+ oil creates on household budgets. When gas is $4+ per gallon and groceries cost more because of shipping disruption and fertilizer prices, the money that would have gone to discretionary spending doesn’t exist.
The -8.55% return in a single quarter represents real wealth destruction for the millions of Americans who hold 401(k)s and index funds weighted toward the broad market — because discretionary is among the largest components of the S&P 500 by market cap.
Financials: -9.40%
This is the most counterintuitive result in the entire sector breakdown, given that the big six banks reported record Q1 profits. The explanation lies in the distinction between current earnings and forward expectations.
Banks generated record profits in Q1 from trading volatility and M&A advisory activity — both of which were war-driven. But the stock market prices future earnings, not past ones. And the forward outlook for banks — which depends on loan growth, credit quality, and net interest income — is less favorable in a world of potential recession, rising defaults, and rate uncertainty. The sector’s -9.40% decline reflects the market’s assessment of what happens to bank earnings when the volatility that generated Q1 profits eventually subsides.
The 46-Point Gap That Reveals Everything
Energy at +37.91%. Financials at -9.40%. A 47-point spread between the best and worst performing sectors in a single quarter.
To put that in context: in the quarter following the 2008 Lehman Brothers collapse — one of the most severe financial disruptions in American economic history — the spread between the best and worst S&P sectors was approximately 30 points.
The Iran war, in its first quarter of full impact, produced a more extreme sector divergence than the immediate aftermath of the 2008 financial crisis.
That is not because the Iran war is worse than 2008. It is because the mechanism is different. The 2008 crisis damaged all sectors roughly proportionally at first — then separated them as the recovery played out differently across industries. The Iran war produced an immediate, clean bifurcation along a single variable: oil.
Own oil: up 38%. Don’t own oil: down 5-10%.
The average American’s 401(k) is a broadly diversified index fund that is heavily weighted toward technology, financials, and consumer discretionary — the three worst-performing sectors of Q1 2026. The average American’s 401(k) did not own significant Energy exposure going into February 28, because energy had been underweight in institutional portfolios for years on ESG and energy-transition grounds.
The war revealed the cost of that underweight in a single quarter.
What Q4 2025 GDP Already Told Us
Before looking at what comes next, it’s worth anchoring the Q1 sector performance in the context of what the overall economy was doing.
The United States economy grew just 0.7% annualized in Q4 2025 — the Commerce Department’s most recent revision. Economists had initially expected 2.5% annualized growth. The miss was enormous: actual growth came in at less than one-third of the consensus forecast.
For the full year 2025, GDP grew 2.1% — down from 2.8% in 2024. The slowing reflected declines across consumer spending, business investment, federal spending, and international trade simultaneously. All four major components of GDP deteriorating in the same quarter is not a coincidence. It is a coordinated slowdown driven by the same underlying forces: tighter financial conditions, policy uncertainty, and the early ripples of the geopolitical disruption that became a full crisis in February 2026.
That was Q4 2025 — before the war.
The first official measurement of the wartime economy arrives Tuesday, April 29, when the Bureau of Economic Analysis releases the advance estimate of Q1 2026 GDP.
Nobody is expecting a good number. The Atlanta Fed’s GDPNow model — which tracks real-time economic activity data and updates continuously — has been projecting negative Q1 GDP growth. Consumer spending slowed. Business investment hesitated. Government spending on the military ramped up, but not enough to offset the other components.
If Tuesday’s GDP print comes in negative — if the United States economy contracted in Q1 2026 for the first time since the brief COVID recession of 2020 — the word “recession” moves from institutional forecast to headline fact. And the policy, market, and political implications of that move are enormous.
The Fed Decision That Lands Tuesday — And What Kevin Warsh Inherits
The Federal Reserve announces its rate decision on Wednesday, April 30 — one day after the GDP print. The sequence is not accidental from a narrative perspective, but the Fed’s decision will have been made before the GDP data is officially released.
What Jerome Powell hands to Kevin Warsh is a monetary policy situation with no clean options.
The current federal funds rate target range is 3.50%–3.75% — the result of 1.75 percentage points of cuts over the past two years. Markets were pricing additional cuts in 2026 before the war began. Those expectations have been significantly revised.
With oil at $106, inflation expectations at 4.8% for the one-year horizon, and CPI running at 3.3% annually — the Fed cannot cut rates without appearing to surrender on its inflation mandate. But with GDP potentially negative, consumer confidence at a 75-year low, and the sector data showing that 5 of 11 S&P sectors lost value in Q1 — the argument for keeping rates elevated when the economy may already be in recession is equally uncomfortable.
Kevin Warsh, who testified before Congress this week that Trump “didn’t ask for” lower rates — deliberately creating distance from the political pressure to cut — is inheriting a situation where both paths carry significant risk.
Hold rates: risk a recession deepening while consumers are already at maximum pessimism. Cut rates: risk re-accelerating inflation while oil is at $106 and peace deal odds are at 10%.
The Q1 sector performance data is the clearest possible illustration of why the decision is so difficult. The sectors that are thriving — energy, materials — are the ones being inflated by the same oil prices that make rate cuts dangerous. The sectors that are suffering — consumer discretionary, financials, technology — are the ones that need rate relief most urgently.
The war has put the Fed in an impossible position. Tuesday’s GDP print will define how impossible that position actually is.
What This Means for Your Portfolio Right Now
The Q1 sector performance data is not historical trivia. It is a roadmap for Q2 — if you know how to read it.
The critical question for the next three months is whether the sector divergence that defined Q1 continues, reverses, or converges.
The case for continuation: Oil stays elevated because the Strait of Hormuz remains effectively closed. Peace deal odds stay at 10%. Energy keeps outperforming. Technology, consumer discretionary, and financials keep underperforming. The K-shaped economy deepens. The divergence between physical assets and financial assets widens.
The case for reversal: A genuine peace agreement emerges. The Strait reopens. Oil falls back toward $70-80. The inflation pressure recedes. The Fed can cut rates. Technology and consumer discretionary recover. Energy gives back a portion of its gains. The index returns to broad-based growth rather than energy-driven divergence.
The case for convergence: GDP comes in negative Tuesday. The word “recession” becomes official. Capital moves uniformly defensive — into cash, short-term Treasuries, gold, and consumer staples. The extreme energy outperformance moderates as recession concerns reduce the forward demand outlook for oil. The tech and discretionary losses moderate as the AI long-term thesis reasserts. All sectors move toward each other, but at lower absolute levels.
The honest answer is that nobody knows which of these three paths materializes. But understanding that the path depends primarily on one variable — what happens with the Strait of Hormuz — gives investors a cleaner decision framework than they typically have.
Watch the peace deal probability. Watch the shipping insurance premiums. Watch the oil price. Those three indicators, tracked together, will tell you which scenario is unfolding faster than any Wall Street analyst report.
The Portfolio Adjustment Most Americans Need to Make
Here is the most direct practical implication of the Q1 sector data for the ordinary American investor.
The typical target-date retirement fund — the default investment for most 401(k) plans — is constructed around the long-term expected returns of the broad market. It is not constructed to respond to a specific geopolitical event that creates a 47-point sector performance gap in a single quarter.
If you have been in a target-date fund or a broad market index for the past several years, you have been systematically underweight energy — because energy has been underweight in the indices that target-date funds track — and heavily weighted toward technology, which has driven broad market returns since 2020.
The Q1 data shows the consequence of that weighting in a wartime energy shock. The technology overweight cost you 7.57% relative to the energy underweight that would have gained you 37.91%.
That does not mean you should sell your technology holdings and buy energy today. That trade may already be crowded. The easy money in the energy rotation was made in March, not April. Chasing sector performance after a 38% gain in a single quarter is a different risk profile than being positioned for it before it happened.
But it does mean that the diversification assumption underlying most retail investor portfolios — “the market will go up over time and I’ll capture that return” — is being stress-tested in a very specific way right now. Broad market returns in Q1 2026 were negative, despite energy surging 38%, because the negative sectors were larger in market-cap weight than the positive ones.
The war revealed that “broad market” diversification and “sector” diversification are not the same thing. And the gap between them, in a single quarter, was 47 points.
This is not financial advice. Always consult a qualified financial advisor before making significant investment decisions. If this gave you a clearer picture of what actually happened to markets in Q1 2026 — and why the number everyone was watching hid the more important story — share it with someone who needs to understand their 401(k) differently. And subscribe below for the next one.
Want to actually take action instead of just reading?
Most people understand what they should do with money — the problem is execution. That’s why I created The $1,000 Money Recovery Checklist.
It’s a simple, step-by-step checklist that shows you:
and how to start building your first $1,000 emergency fund without overwhelm.
where your money is leaking,
what to cut or renegotiate first,
how to protect your savings,
and how to start building your first $1,000 emergency fund without overwhelm.
No theory. No motivation talk. Just clear actions you can apply today.
If you want a practical next step after this article, click the button below and get instant access.