Yesterday morning, the Bureau of Economic Analysis released the number everyone had been dreading.
The first official measurement of the American economy during wartime. The first GDP print since oil closed the Strait of Hormuz. The data that would either confirm or deny the recession fears that have been building for two months.
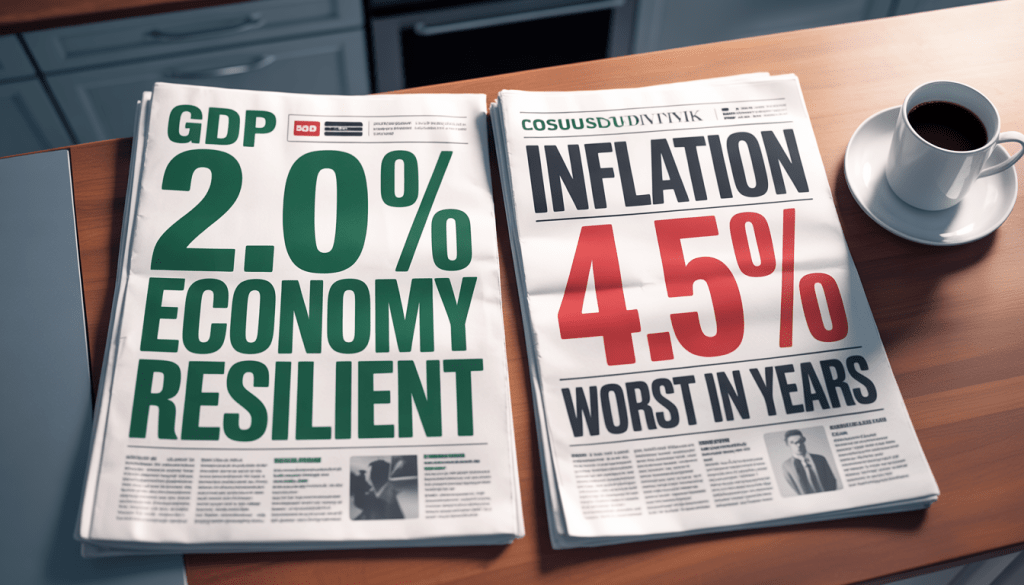
The headline read: 2.0% growth.
Markets breathed. Anchors smiled. The word “resilient” appeared in approximately 400 separate financial news headlines within the first hour.
And almost nobody explained what is actually inside that 2.0% number. Almost nobody explained that the headline is constructed almost entirely from factors that will not repeat in Q2. Almost nobody explained that buried inside the same GDP report — released simultaneously with the headline — is an inflation number that should change how every American thinks about their financial life for the rest of 2026.
Here is what actually happened. Here is what the 2.0% is made of. And here is the number that matters more than the headline.
The 2.0% That Isn’t What It Looks Like
Real GDP increased at an annual rate of 2.0 percent in the first quarter of 2026, according to the advance estimate released by the U.S. Bureau of Economic Analysis. In the fourth quarter of 2025, real GDP increased 0.5 percent.
From 0.5% to 2.0% sounds like an acceleration. A recovery. Evidence that the Iran war has not derailed the economy.
But the headline rebound was driven largely by mechanical factors rather than fresh private-sector strength. Federal nondefense compensation snapped back as the late-2025 government shutdown reversed, and Iran-related defense spending added another layer to the growth print.
Strip those two distortions out and the picture changes dramatically.
Distortion one: The government shutdown bounce.
Federal nondefense employee compensation collapsed during the Q4 2025 shutdown and rebounded in Q1 2026 as workers returned and back pay flowed through the income accounts. That swing alone contributed a meaningful share of the 1.5 percentage-point pickup from Q4 to Q1.
This is not new economic activity. This is the government paying workers who weren’t paid last quarter. It shows up as Q1 growth. It will not repeat in Q2. The quarter that looks like a recovery is partly a mathematical artifact of a government shutdown that ended.
Distortion two: Iran war defense spending.
The Iran war has driven an extraordinary surge in government defense spending — new munitions contracts, accelerated procurement, force deployments, intelligence operations. That spending is counted as GDP. It is real economic activity. But it is activity driven by a war, not by organic economic growth. It is activity that consumes resources — capital, manufacturing capacity, skilled workers — that would otherwise be deployed in the private economy.
Government spending was led by federal employee compensation increasing after the end of the government shutdown that occurred in the fourth quarter, when it collapsed. The same government line that was crushed by the shutdown bounced by war spending.
What the “real” economy did in Q1:
The bigger question for the next two quarters is whether private consumption can pick up the baton as the shutdown-rebound and defense-spending tailwinds fade. Without that handoff, the 2.0% headline risks looking like the high water mark rather than the start of a new acceleration phase.
Consumer spending showed signs of fatigue. Investment in residential structures declined. Even as the AI buildout boosted equipment spending, housing continued to weaken.
Spending on imports grew significantly more than did spending on exports, resulting in net exports reducing real GDP growth by 1.3 percentage points.
The trade deficit subtracted 1.3 percentage points from growth. Housing construction fell. Consumer spending decelerated from recent quarters.
The 2.0% headline is a number assembled from a government shutdown reversal and war spending, masking a private sector that is slowing down in the face of $4+ gasoline, record credit card debt, and the highest inflation in years.
Q1 2026 GDP printing at 2.0% looks reassuring on the surface but reads as a fragile rebound once the federal compensation snapback and Iran-related defense outlays are isolated.
The Number Nobody Is Leading With
Here is the number that was released simultaneously with the 2.0% GDP headline — and that received a fraction of the media attention.
The personal consumption expenditures (PCE) price index increased 4.5 percent, compared with an increase of 2.9 percent. The PCE price index excluding food and energy increased 4.3 percent, compared with an increase of 2.7 percent.
Read those numbers again.
The PCE price index — the Federal Reserve’s preferred measure of inflation, the one it has been fighting for three years, the one it has a 2% target for — just printed at 4.5%.
Core PCE, which strips out volatile food and energy prices to reveal underlying inflation — just printed at 4.3%.
For context:
- The Fed’s inflation target is 2.0%
- Core PCE in Q4 2025 was 2.7%
- Core PCE in Q1 2026 is 4.3%
In a single quarter, the Fed’s preferred inflation gauge moved from 2.7% to 4.3%. A 1.6 percentage point surge. The largest quarterly acceleration in core PCE since the initial post-COVID inflation burst of 2021.
When the BEA says the PCE price index rose at a 4.5% annualized rate, it means that if prices kept rising at their Q1 pace for a full year, the average American would see their purchasing power fall by roughly 4.5% from inflation alone. The Federal Reserve has spent two years trying to bring inflation down to 2%, and this quarter it moved sharply in the wrong direction.
Why 4.3% Core PCE Is the Most Important Number of 2026
The distinction between headline PCE and core PCE matters enormously for monetary policy — and therefore for your mortgage rate, your credit card rate, and the cost of everything you buy.
Headline PCE includes food and energy. It is more volatile. It can spike when oil spikes and fall when oil falls. The Fed is supposed to “look through” headline moves driven by energy, because they are often temporary.
Core PCE — the number that just hit 4.3% — is different. It strips out food and energy to reveal the underlying inflation pressure in the economy: services, rent, wages, healthcare, insurance, education. These categories change slowly. When they accelerate, they tend to stay accelerated for months or quarters.
Core PCE at 4.3% is not an oil price story. It is a wage story. A rent story. A services story. It is the inflation that was supposedly under control — the inflation that the Fed’s rate hiking cycle was supposed to have contained — surging back toward levels not seen since 2022.
The implications for monetary policy are severe and immediate.
The IMF cautioned that with the policy rate close to neutral, there is little room to cut interest rates in 2026, particularly given the rise in energy prices, the likely passthrough to core inflation, and the upside risks to global commodity prices that are likely to further delay the return to the inflation target.
The IMF was warning about this scenario before the Q1 data was released. The Q1 data confirmed it — and then some. Core PCE at 4.3% doesn’t just make rate cuts impossible. It raises the question of whether the Fed needs to consider rate increases at a moment when the economy, stripped of its one-time factors, is slowing.
That combination — slowing private sector growth and surging core inflation — is the definition of stagflation. And the Q1 GDP report is the most explicit stagflation data print the United States has produced since the 1970s.
The Stagflation Trap: Why There Is No Good Policy Response
Stagflation is the economic condition that central banks are least equipped to handle. Every tool the Fed has works in one direction or the other — it cannot simultaneously fight inflation and support growth.
Normal recession: Growth falls, inflation falls. Fed cuts rates. Works. Normal overheating: Growth surges, inflation rises. Fed raises rates. Works. Stagflation: Growth falls, inflation rises simultaneously. Fed has no clean answer.
The inherent ambiguity in the monetary-policy path out of stagflation was amplified by the disruption to the dataflow from the October government shutdown. In the second half of the year, the data will provide more clarity as to which side of the stagflation dilemma, and therefore, which side of the Fed’s dual mandate, requires more attention.
But the Q1 data has made the dilemma sharper, not clearer. Core PCE at 4.3% is unambiguously above target. Private sector growth, stripped of one-time factors, is decelerating. Even if diplomacy prevails, the negative shock to the economy is already set in motion. Spillovers are likely to extend into the second half of the year — even if a peace agreement is reached in the coming weeks.
This means the Fed faces two deeply uncomfortable options going into June’s meeting — the first meeting where Kevin Warsh will occupy the chair.
Option A: Hold rates and accept that core PCE at 4.3% will continue to erode household purchasing power month after month, that inflation expectations will continue drifting higher from their already elevated 4.8% level, and that the Fed’s credibility on its inflation mandate will weaken.
Option B: Raise rates into a slowing private economy where consumers are already stretched — record credit card debt, 75-year-low sentiment, decelerating spending — and risk tipping a fragile growth picture into an outright recession.
There is no Option C that makes both problems go away simultaneously. The Q1 GDP report eliminated the possibility that the situation would resolve itself quietly.
What the GDP Report Means for Your Wallet
The abstract becomes personal very quickly.
Your mortgage rate. The 30-year fixed mortgage rate is priced against the 10-year Treasury yield, which is priced against inflation expectations. Treasury yields ticked higher on the firmer price index immediately after the GDP release. Core PCE at 4.3% tells bond markets that inflation is not under control. Bond markets that see uncontrolled inflation demand higher yields as compensation. Higher yields mean higher mortgage rates. The 30-year fixed rate, already at 6.75-7%, has another reason to stay elevated or rise further.
Your purchasing power. If prices kept rising at their Q1 pace for a full year, the average American would see their purchasing power fall by roughly 4.5% from inflation alone. That is not a hypothetical. That is the annualized pace of what just happened in the first three months of 2026. If your wages are not rising at 4.5%+ annually, you are getting poorer in real terms. The median American wage growth is running well below that.
Your savings. High-yield savings accounts paying 4.5-5% annualized are, in a world of 4.5% PCE inflation, producing exactly zero real return. The money sitting in your high-yield savings account is keeping pace with inflation — no better, no worse. That is not a bad outcome, but it is not the real return that most people assume when they see 4.5% APY on their savings app.
Your credit card debt. Credit card rates at 22-24% are not coming down if the Fed cannot cut rates. The Q1 inflation data has pushed any Fed rate cuts further into the future. Every month of delay is another month of 22% interest compounding on the record $1.277 trillion in American credit card balances.
Your job security. AI, which has had minimal impact on labor demand so far, could begin to weigh on hiring. More subtly, optimism about AI could act as a drag on the labor market if it gives CEOs greater confidence — or cover — to reduce headcount. Add that to the war-driven uncertainty already causing companies to freeze hiring plans, and the labor market that has held up through the first quarter of 2026 faces meaningful downside risk in Q2 and Q3.
The Q2 Problem Nobody Is Modeling Yet
The Q1 number, whatever its construction, is done. It will be revised once on May 28 and again on June 25 — and the revisions could be meaningful either up or down, as they were for Q4 2025 (revised from 1.4% to 0.5% over two rounds of revisions).
But the Q2 picture is what should dominate strategic thinking right now. And the Q2 picture, from everything visible today, is significantly more challenging than Q1.
The shutdown bounce will not repeat. Federal employee compensation will not receive a second one-time bounce. That contribution to GDP disappears.
The defense spending surge may continue, but the first-quarter effect of accelerated procurement contracts flowing into GDP calculations will moderate as the pipeline catches up with demand.
Consumer spending decelerated in Q1. Gas prices above $4 nationally — and the pharmaceutical tariff costs beginning to flow through to household budgets — will continue to constrain discretionary spending in Q2.
The jump in energy prices will take some of the shine off what would otherwise have been a strong year for the economy. Some of the strength of consumer spending in March is payback for the poor weather at the start of the year. Fiscal stimulus is more than outweighing the drag from higher energy prices for now, but that balance will begin to shift in the months ahead, especially with gas prices still climbing.
The Q2 GDP print — which won’t be available until late July — will be the data point that determines whether 2026 is a year of resilient growth-with-inflation, or the first year of a stagflationary contraction that the Q1 number only hinted at.
The question “is this a recession?” cannot be answered until Q2 data arrives. But the ingredients for a negative Q2 are visible in today’s report.
The One Question This Data Demands
Jerome Powell spent his last Fed press conference yesterday choosing words with extraordinary precision. He held rates. He said “patient.” He preserved optionality. He did not say the word stagflation.
The Q1 GDP data, released this morning, is the first piece of official evidence for what Powell would not name.
Core PCE at 4.3% — more than twice the Fed’s target. GDP growth built on a government shutdown reversal and war spending. Consumer spending decelerating. Housing contracting. A trade deficit subtracting 1.3 percentage points from growth.
The word Powell will not say is the word that describes this data most accurately.
Kevin Warsh inherits this economy in the next few weeks. His first June press conference — with updated economic projections — will be the moment when the Fed either acknowledges the stagflation diagnosis explicitly or continues to manage around it with language designed to preserve optionality.
The data will not wait for the language to catch up.
Core PCE at 4.3% is not a forecast. It is not a scenario. It is a measurement of what happened between January and March 2026 in the American economy.
The 2.0% headline was the number that sounded reassuring.
4.3% core PCE is the number that tells you what is actually happening.
This is not financial advice. Always consult a qualified financial advisor before making significant financial decisions. If this helped you understand why the “good” GDP number yesterday deserved a closer look — share it with someone who took the headline at face value. The number that matters most was the one that didn’t trend. And subscribe below for the next one.
Want to actually take action instead of just reading?
Most people understand what they should do with money — the problem is execution. That’s why I created The $1,000 Money Recovery Checklist.
It’s a simple, step-by-step checklist that shows you:
and how to start building your first $1,000 emergency fund without overwhelm.
- where your money is leaking,
- what to cut or renegotiate first,
- how to protect your savings,
- and how to start building your first $1,000 emergency fund without overwhelm.
No theory. No motivation talk. Just clear actions you can apply today.
If you want a practical next step after this article, click the button below and get instant access.
>Get The $1,000 Money Recovery Checklist<

Leave a comment