The stock market didn’t crash.
That’s the story most people heard about the first quarter of 2026. The Iran war started on February 28. The Strait of Hormuz closed. Oil surged above $140. Consumer confidence hit a 75-year low. And yet the S&P 500 didn’t collapse. It wobbled. It whipsawed. It had days of terror and days of relief. But the index itself — the number everyone watches on the evening news — ended the quarter without a catastrophic breakdown.
So most people concluded: the market handled it.
They are looking at the wrong number.
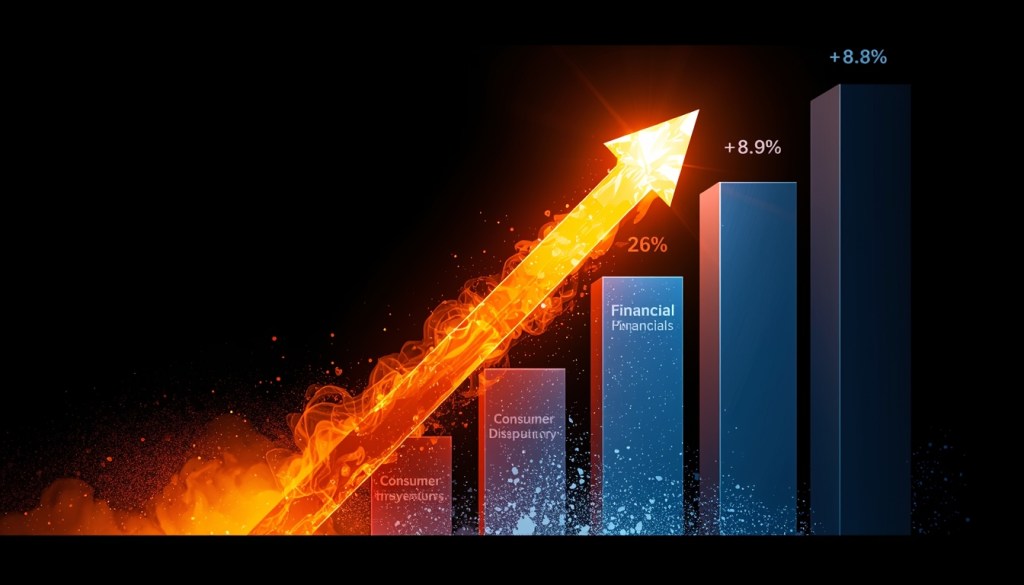
Here is the number they should be looking at. In Q1 2026, the Energy sector of the S&P 500 returned positive 37.91%. In the same quarter, the Consumer Discretionary sector returned negative 8.55%. The Financials sector returned negative 9.40%. Technology returned negative 7.57%.
A 37.91% gap between the best and worst sectors — in a single quarter — is the largest sector performance divergence recorded since the 2008 financial crisis.
The market didn’t crash. It split. Violently. Into winners and losers that could not be more different. And the split maps almost perfectly onto a single variable: exposure to the price of oil.
If you held the wrong sectors going into February 28, the Iran war cost you 8-10% of your portfolio value in three months.
If you held the right sectors, you made 38%.
Most Americans hold the wrong sectors. Here is why — and what it means for the next quarter.
The Quarter in Full: What Each Sector Did and Why
Understanding the Q1 2026 sector performance map requires understanding the specific mechanism through which the Iran war affected each part of the economy. The numbers are not random. Every sector’s performance traces directly to its relationship with energy prices, supply chains, and the interest rate environment created by the conflict.
Energy: +37.91%
The arithmetic is simple. Oil went from approximately $70 per barrel at the start of 2026 to above $140 at the peak of the Strait crisis. Companies that produce, transport, refine, and sell oil and gas saw revenue surge proportionally. ExxonMobil, Chevron, ConocoPhillips, EOG Resources, Pioneer Natural Resources — every major US energy producer reported or guided to earnings that reflected the extraordinary windfall of $100+ oil.
The sector’s +37.91% in a single quarter puts it on pace — if sustained — for a return of roughly 150% annualized. That is not a typo. That is the math of a commodity that doubled in price when the businesses producing it had largely fixed production costs.
The irony is that energy was one of the most hated sectors among institutional investors entering 2026. ESG mandates had reduced energy exposure across pension funds and sovereign wealth funds. The AI boom had redirected capital toward technology. The prevailing view was that energy was a “value trap” in a world transitioning to clean power.
The Iran war made that view catastrophically expensive for the investors who held it.
Materials: +10.68%
The materials sector — mining companies, chemical producers, metals and minerals — benefited from two war-related dynamics simultaneously. First, oil price inflation inflated the cost of energy inputs across global manufacturing, raising the nominal value of material outputs. Second, the supply chain disruptions created by the Strait closure created shortages of specific materials — sulfur, certain industrial chemicals, specialty metals — that flow through Middle Eastern supply chains.
Gold mining companies saw particular strength as gold hit and then exceeded $3,300 per ounce — the safe-haven trade that runs parallel to every geopolitical escalation in the modern era.
Utilities: +8.26%
The utilities sector’s outperformance reveals something important about how the war reshaped the investment landscape. Utilities are traditionally considered a “defensive” sector — slow growth, high dividends, stable earnings regardless of economic conditions. They are the sector you own when you are afraid.
But in Q1 2026, utilities got a second tailwind beyond fear: the AI energy demand story. The same sector that provides power to data centers, that is building new transmission infrastructure, that is benefiting from the nuclear energy renaissance — utilities became simultaneously a fear trade and a structural growth trade. That combination produced the 8.26% return.
Consumer Staples: +6.12%
Similar logic to utilities. When consumers are afraid, they keep buying necessities. When institutional investors are repositioning toward defensive sectors, consumer staples benefit. Procter & Gamble, Costco, Walmart, Kroger — the companies selling things people buy regardless of how the war is going — absorbed capital rotating out of more exposed sectors.
The fact that Walmart is in this list while Consumer Discretionary is down 8.55% is the most direct visual representation of the K-shaped economy this post has described throughout this series. Walmart up. Luxury and discretionary retail crushed.
Industrials: +4.55%
A mixed picture within a positive return. Defense contractors — Lockheed Martin, Northrop Grumman, Raytheon, General Dynamics — had a spectacular quarter as defense spending expectations surged globally. Infrastructure companies benefited from the same government spending tailwind.
But non-defense industrials — manufacturing companies dependent on global supply chains, transportation companies facing fuel cost surges — were under significant pressure within the sector. The positive return masks a wide internal dispersion.
Real Estate: +1.87%
The smallest positive return of the positive sectors, and the one most at risk in Q2. Real estate investment trusts are fundamentally interest-rate-sensitive instruments — their value depends on the spread between property yields and borrowing costs. Higher interest rates compress that spread and reduce REIT valuations.
The positive return in Q1 reflects the beginning-of-year rate cut expectations that the war subsequently destroyed. REITs that rallied on the assumption of Fed cuts are now sitting in portfolios where those cuts are no longer priced. The 1.87% gain may reverse in Q2 as the “higher for longer” reality fully penetrates real estate valuations.
Communication Services: -5.53%
Alphabet, Meta, Netflix, Disney — the companies that dominate this sector face a specific war-related headwind: advertising revenue is cyclically sensitive to economic confidence, and economic confidence collapsed in Q1. When businesses are uncertain, advertising budgets are among the first expenses to be reduced. The 5.53% decline reflects both the advertising cycle and the general rotation away from growth-oriented assets.
Health Care: -4.90%
The pharmaceutical tariff announcement on April 2 — 100% tariffs on branded drug imports — arrived after the quarter ended, but health care stocks began pricing the regulatory risk as administration intentions became clear. Additionally, health care as a sector carries meaningful supply chain exposure to the same global trade disruptions that hurt other import-dependent sectors.
Technology: -7.57%
The sector that defined the bull market of 2023-2025 — AI chips, cloud computing, software platforms, consumer hardware — gave back significant gains in Q1 as the war created a specific headwind for the AI investment thesis: higher energy costs threaten the economics of the data center buildout that powers the entire sector.
IBM maintained full-year guidance after its earnings beat but the stock fell 8% because investors expected better. ServiceNow crashed 18% because the Middle East conflict explicitly hindered subscription revenue growth. The “Magnificent Seven” — whose earnings growth is projected at roughly 18% for full year 2026 — are seeing their influence on the overall market moderate as the rotation away from technology concentration continues.
Consumer Discretionary: -8.55%
Amazon, Tesla, Home Depot, Nike, McDonald’s — the sector representing everything Americans spend money on beyond necessities. This is the sector most exposed to the squeeze that $100+ oil creates on household budgets. When gas is $4+ per gallon and groceries cost more because of shipping disruption and fertilizer prices, the money that would have gone to discretionary spending doesn’t exist.
The -8.55% return in a single quarter represents real wealth destruction for the millions of Americans who hold 401(k)s and index funds weighted toward the broad market — because discretionary is among the largest components of the S&P 500 by market cap.
Financials: -9.40%
This is the most counterintuitive result in the entire sector breakdown, given that the big six banks reported record Q1 profits. The explanation lies in the distinction between current earnings and forward expectations.
Banks generated record profits in Q1 from trading volatility and M&A advisory activity — both of which were war-driven. But the stock market prices future earnings, not past ones. And the forward outlook for banks — which depends on loan growth, credit quality, and net interest income — is less favorable in a world of potential recession, rising defaults, and rate uncertainty. The sector’s -9.40% decline reflects the market’s assessment of what happens to bank earnings when the volatility that generated Q1 profits eventually subsides.
The 46-Point Gap That Reveals Everything
Energy at +37.91%. Financials at -9.40%. A 47-point spread between the best and worst performing sectors in a single quarter.
To put that in context: in the quarter following the 2008 Lehman Brothers collapse — one of the most severe financial disruptions in American economic history — the spread between the best and worst S&P sectors was approximately 30 points.
The Iran war, in its first quarter of full impact, produced a more extreme sector divergence than the immediate aftermath of the 2008 financial crisis.
That is not because the Iran war is worse than 2008. It is because the mechanism is different. The 2008 crisis damaged all sectors roughly proportionally at first — then separated them as the recovery played out differently across industries. The Iran war produced an immediate, clean bifurcation along a single variable: oil.
Own oil: up 38%. Don’t own oil: down 5-10%.
The average American’s 401(k) is a broadly diversified index fund that is heavily weighted toward technology, financials, and consumer discretionary — the three worst-performing sectors of Q1 2026. The average American’s 401(k) did not own significant Energy exposure going into February 28, because energy had been underweight in institutional portfolios for years on ESG and energy-transition grounds.
The war revealed the cost of that underweight in a single quarter.
What Q4 2025 GDP Already Told Us
Before looking at what comes next, it’s worth anchoring the Q1 sector performance in the context of what the overall economy was doing.
The United States economy grew just 0.7% annualized in Q4 2025 — the Commerce Department’s most recent revision. Economists had initially expected 2.5% annualized growth. The miss was enormous: actual growth came in at less than one-third of the consensus forecast.
For the full year 2025, GDP grew 2.1% — down from 2.8% in 2024. The slowing reflected declines across consumer spending, business investment, federal spending, and international trade simultaneously. All four major components of GDP deteriorating in the same quarter is not a coincidence. It is a coordinated slowdown driven by the same underlying forces: tighter financial conditions, policy uncertainty, and the early ripples of the geopolitical disruption that became a full crisis in February 2026.
That was Q4 2025 — before the war.
The first official measurement of the wartime economy arrives Tuesday, April 29, when the Bureau of Economic Analysis releases the advance estimate of Q1 2026 GDP.
Nobody is expecting a good number. The Atlanta Fed’s GDPNow model — which tracks real-time economic activity data and updates continuously — has been projecting negative Q1 GDP growth. Consumer spending slowed. Business investment hesitated. Government spending on the military ramped up, but not enough to offset the other components.
If Tuesday’s GDP print comes in negative — if the United States economy contracted in Q1 2026 for the first time since the brief COVID recession of 2020 — the word “recession” moves from institutional forecast to headline fact. And the policy, market, and political implications of that move are enormous.
The Fed Decision That Lands Tuesday — And What Kevin Warsh Inherits
The Federal Reserve announces its rate decision on Wednesday, April 30 — one day after the GDP print. The sequence is not accidental from a narrative perspective, but the Fed’s decision will have been made before the GDP data is officially released.
What Jerome Powell hands to Kevin Warsh is a monetary policy situation with no clean options.
The current federal funds rate target range is 3.50%–3.75% — the result of 1.75 percentage points of cuts over the past two years. Markets were pricing additional cuts in 2026 before the war began. Those expectations have been significantly revised.
With oil at $106, inflation expectations at 4.8% for the one-year horizon, and CPI running at 3.3% annually — the Fed cannot cut rates without appearing to surrender on its inflation mandate. But with GDP potentially negative, consumer confidence at a 75-year low, and the sector data showing that 5 of 11 S&P sectors lost value in Q1 — the argument for keeping rates elevated when the economy may already be in recession is equally uncomfortable.
Kevin Warsh, who testified before Congress this week that Trump “didn’t ask for” lower rates — deliberately creating distance from the political pressure to cut — is inheriting a situation where both paths carry significant risk.
Hold rates: risk a recession deepening while consumers are already at maximum pessimism. Cut rates: risk re-accelerating inflation while oil is at $106 and peace deal odds are at 10%.
The Q1 sector performance data is the clearest possible illustration of why the decision is so difficult. The sectors that are thriving — energy, materials — are the ones being inflated by the same oil prices that make rate cuts dangerous. The sectors that are suffering — consumer discretionary, financials, technology — are the ones that need rate relief most urgently.
The war has put the Fed in an impossible position. Tuesday’s GDP print will define how impossible that position actually is.
What This Means for Your Portfolio Right Now
The Q1 sector performance data is not historical trivia. It is a roadmap for Q2 — if you know how to read it.
The critical question for the next three months is whether the sector divergence that defined Q1 continues, reverses, or converges.
The case for continuation: Oil stays elevated because the Strait of Hormuz remains effectively closed. Peace deal odds stay at 10%. Energy keeps outperforming. Technology, consumer discretionary, and financials keep underperforming. The K-shaped economy deepens. The divergence between physical assets and financial assets widens.
The case for reversal: A genuine peace agreement emerges. The Strait reopens. Oil falls back toward $70-80. The inflation pressure recedes. The Fed can cut rates. Technology and consumer discretionary recover. Energy gives back a portion of its gains. The index returns to broad-based growth rather than energy-driven divergence.
The case for convergence: GDP comes in negative Tuesday. The word “recession” becomes official. Capital moves uniformly defensive — into cash, short-term Treasuries, gold, and consumer staples. The extreme energy outperformance moderates as recession concerns reduce the forward demand outlook for oil. The tech and discretionary losses moderate as the AI long-term thesis reasserts. All sectors move toward each other, but at lower absolute levels.
The honest answer is that nobody knows which of these three paths materializes. But understanding that the path depends primarily on one variable — what happens with the Strait of Hormuz — gives investors a cleaner decision framework than they typically have.
Watch the peace deal probability. Watch the shipping insurance premiums. Watch the oil price. Those three indicators, tracked together, will tell you which scenario is unfolding faster than any Wall Street analyst report.
The Portfolio Adjustment Most Americans Need to Make
Here is the most direct practical implication of the Q1 sector data for the ordinary American investor.
The typical target-date retirement fund — the default investment for most 401(k) plans — is constructed around the long-term expected returns of the broad market. It is not constructed to respond to a specific geopolitical event that creates a 47-point sector performance gap in a single quarter.
If you have been in a target-date fund or a broad market index for the past several years, you have been systematically underweight energy — because energy has been underweight in the indices that target-date funds track — and heavily weighted toward technology, which has driven broad market returns since 2020.
The Q1 data shows the consequence of that weighting in a wartime energy shock. The technology overweight cost you 7.57% relative to the energy underweight that would have gained you 37.91%.
That does not mean you should sell your technology holdings and buy energy today. That trade may already be crowded. The easy money in the energy rotation was made in March, not April. Chasing sector performance after a 38% gain in a single quarter is a different risk profile than being positioned for it before it happened.
But it does mean that the diversification assumption underlying most retail investor portfolios — “the market will go up over time and I’ll capture that return” — is being stress-tested in a very specific way right now. Broad market returns in Q1 2026 were negative, despite energy surging 38%, because the negative sectors were larger in market-cap weight than the positive ones.
The war revealed that “broad market” diversification and “sector” diversification are not the same thing. And the gap between them, in a single quarter, was 47 points.
This is not financial advice. Always consult a qualified financial advisor before making significant investment decisions. If this gave you a clearer picture of what actually happened to markets in Q1 2026 — and why the number everyone was watching hid the more important story — share it with someone who needs to understand their 401(k) differently. And subscribe below for the next one.
Want to actually take action instead of just reading?
Most people understand what they should do with money — the problem is execution. That’s why I created The $1,000 Money Recovery Checklist.
It’s a simple, step-by-step checklist that shows you:
and how to start building your first $1,000 emergency fund without overwhelm.
- where your money is leaking,
- what to cut or renegotiate first,
- how to protect your savings,
- and how to start building your first $1,000 emergency fund without overwhelm.
No theory. No motivation talk. Just clear actions you can apply today.
If you want a practical next step after this article, click the button below and get instant access.
>Get The $1,000 Money Recovery Checklist<

Leave a comment